Qubit vs Power BI
Power BI puts DAX, data models, and refresh settings between your team and custom analysis. Qubit lets business users investigate prepared data by asking questions.
- 140+ integrations
- Built-in data warehouse
- Recurring workflows
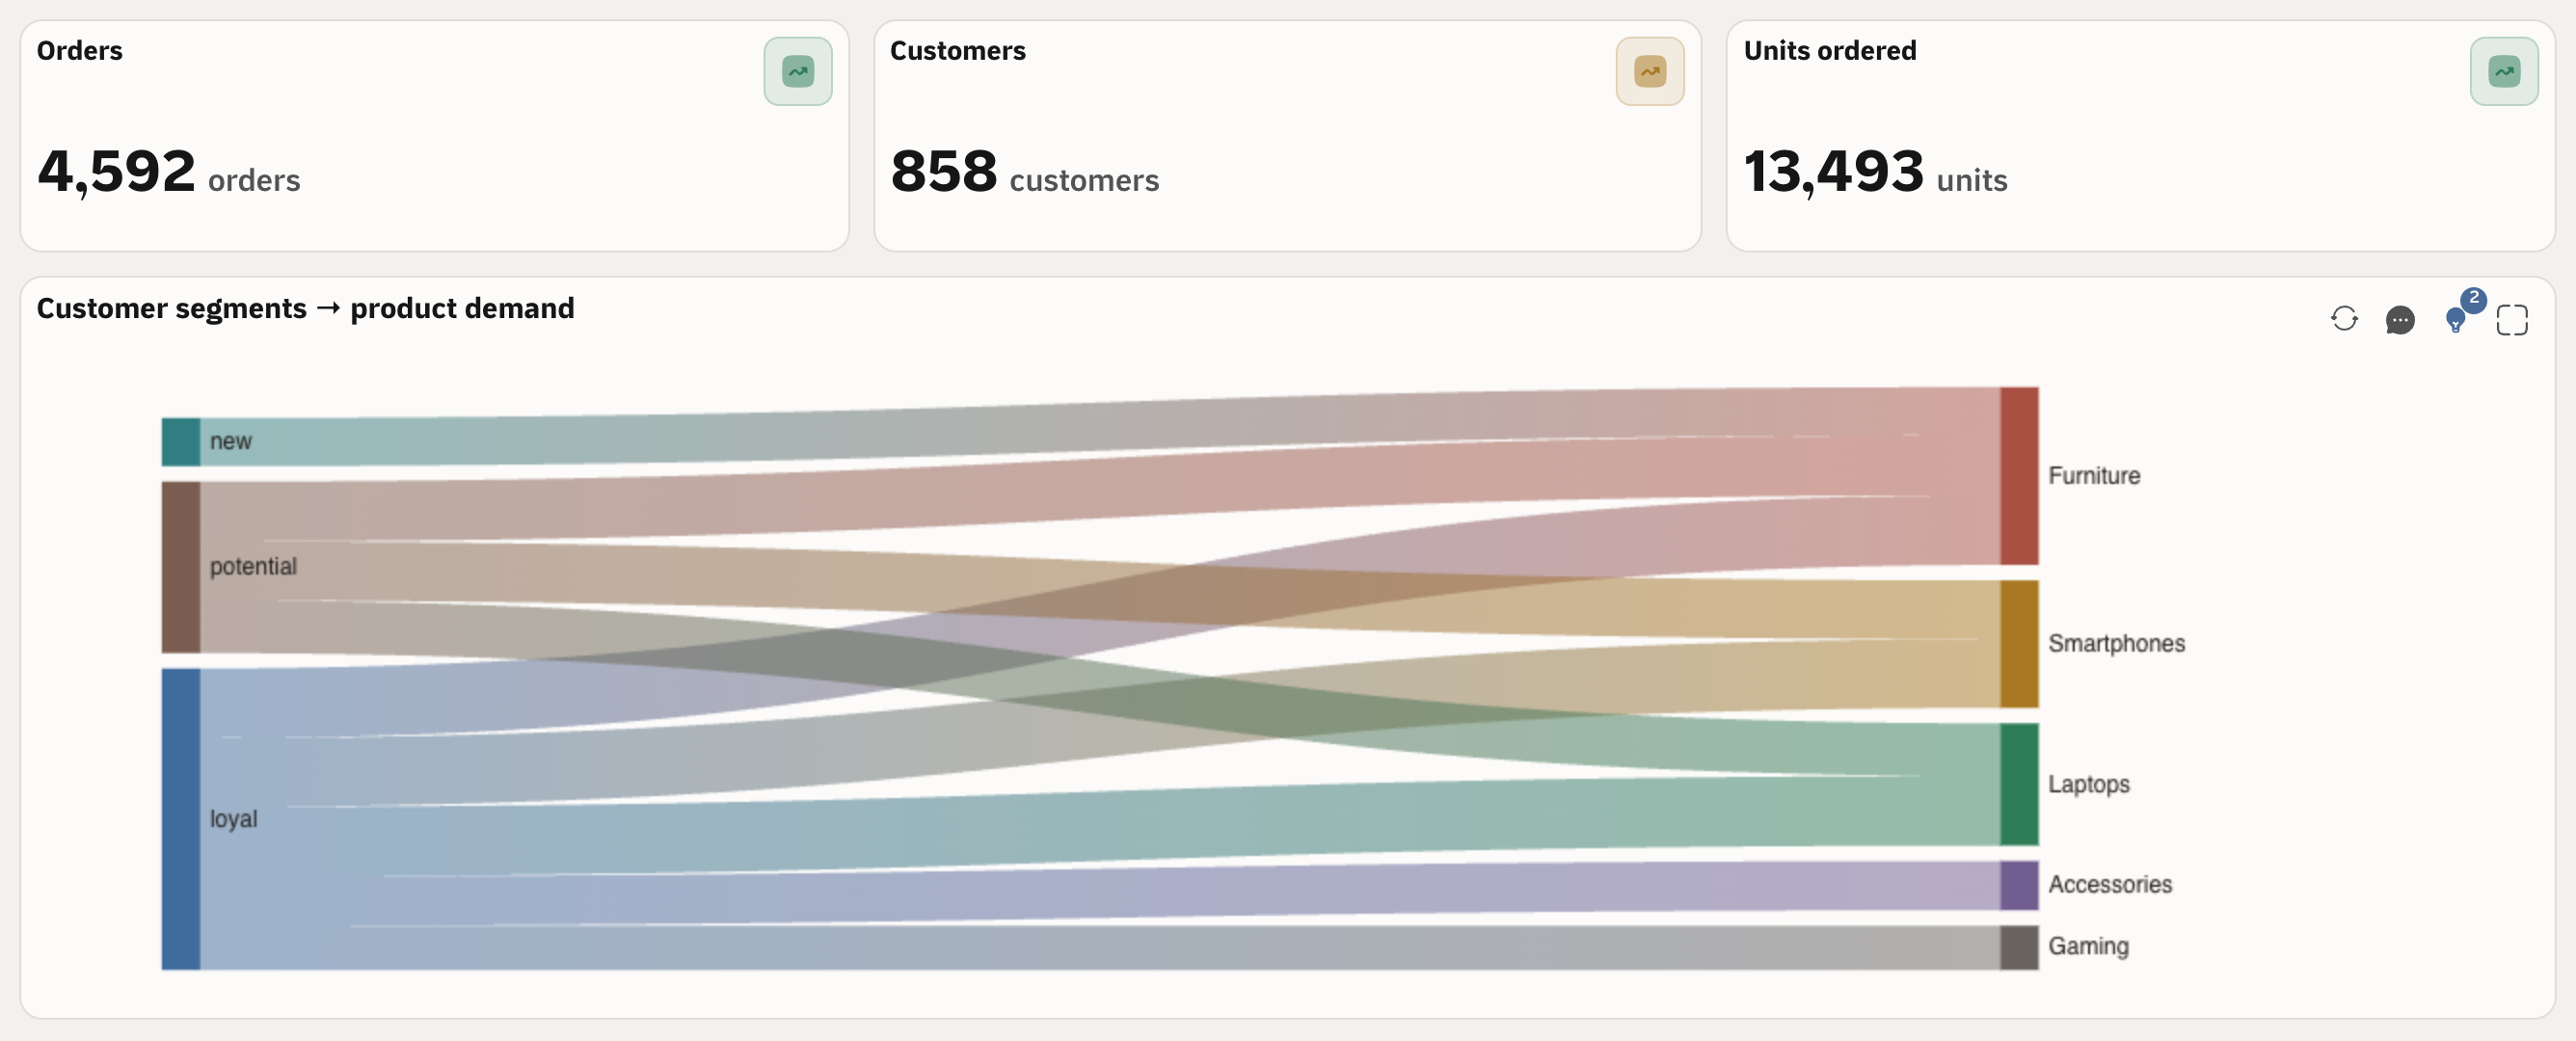
Spend less time waiting for the report builder.
Opening a dashboard is easy. Changing how margin is calculated or fixing a broken refresh takes different skills. If one specialist owns all of that, their calendar becomes part of every reporting deadline. In Qubit, the business team asks and follows up directly.
Custom numbers need modeling skills
Power BIBasic reports can be built visually. Custom measures can require DAX, an understanding of relationships and filter context, and someone to check the calculation is right.
With QubitAsk about sales, costs, or changes in plain language once sources and metric definitions are configured.
Refresh failures become technical work
Power BIYour team manages model refreshes, credentials, and gateways where needed. A renamed source column can break a refresh and force a model update.
With QubitSource sync, storage, and scheduled analysis all run inside Qubit.
The seat price is only part of the bill
Power BIPro and Premium Per User are reporting licenses. Fabric capacity and any separate data infrastructure cost extra when your setup needs them, plus the time to maintain them.
With QubitQubit plans include storage and analysis, with published user and usage limits.
Connecting sources, defining metrics, and setting permissions are part of setup in Qubit as well. Advanced access controls and usage limits depend on your plan.
Compare at a glance
- Available
- Needs setup or a paid upgrade
- Not built in
| What to compare |  Decision intelligence Decision intelligence |  Power BIBusiness intelligence Power BIBusiness intelligence |
|---|---|---|
| What the product covers | Storage, analysis, and workflows togetherChat, dashboards, monitoring, reports, and scheduled workflows on the same data. | Requires setupBusiness reporting and analytics in the Microsoft ecosystem. |
| Your team’s workspace | Built for business teamsAsk questions, build dashboards, schedule reviews. | AvailableReports, dashboards, and Microsoft Fabric integration |
| Analysis without writing code | Ask business questions without writing SQLOnce sources, metrics, and access are configured, business teams can ask questions and follow up in plain language. | AvailableBasic reports need no code. Custom measures can require DAX formulas and an understanding of the data model. |
| Business context | Shared definitionsMetric definitions and data relationships that span all your sources. | AvailableData preparation and modeling in the Microsoft ecosystem |
| Built-in data warehouse | Qubit can be your data warehouseSync supported sources into Qubit’s data store, or query supported databases directly. | Requires setupImport, DirectQuery, or Direct Lake, with semantic models and refresh settings. |
| Source protection | Read-only analysis queriesAnalysis queries are checked before execution and blocked if they modify data. This also applies to administrators. | Requires setupSource permissions and the selected connection mode govern data access. |
| Who can see your data | Control access down to rowsHigher plan requiredConfigure access to connections and datasets, with row filters applied to analysis queries. | AvailableSemantic-model row-level security; enforcement also depends on workspace roles. |
| Audit & traceability | Review activity and report sourcesWorkspace activity logs, plus the SQL and data sources behind each generated report. | AvailablePower BI activity logs expose user actions through administration APIs. |
| Setup & maintenance | Fewer services to assembleData sync, storage, analysis, and workflows in one platform that we host and run. | Refresh failures become technical workYour team manages model refreshes, credentials, and gateways where needed. A renamed source column can break a refresh and force a model update. |
| Costs beyond the subscription | Storage and analysis in your planEach plan sets limits for users, storage, and usage. Your source systems and any external services you choose are billed separately. | The seat price is only part of the billPro and Premium Per User are reporting licenses. Fabric capacity and any separate data infrastructure cost extra when your setup needs them, plus the time to maintain them. |
| Published pricing (USD) | From $9/month for one userTeams from $99/month including 2 users, plus $15 per extra user up to the plan limit. Advanced access controls require a higher plan. See plans for full limits. | PricingPro: $14/user/month. Premium Per User: $24/user/month. Both billed annually; Fabric capacity is separate. |
Synced data is stored in Qubit. Advanced access controls, feature availability, and usage limits depend on your plan and setup.
Source: Power BI documentationPrices checked 27 September 2026. Plans, included features, and taxes can vary. See Power BI pricing and Qubit plans.
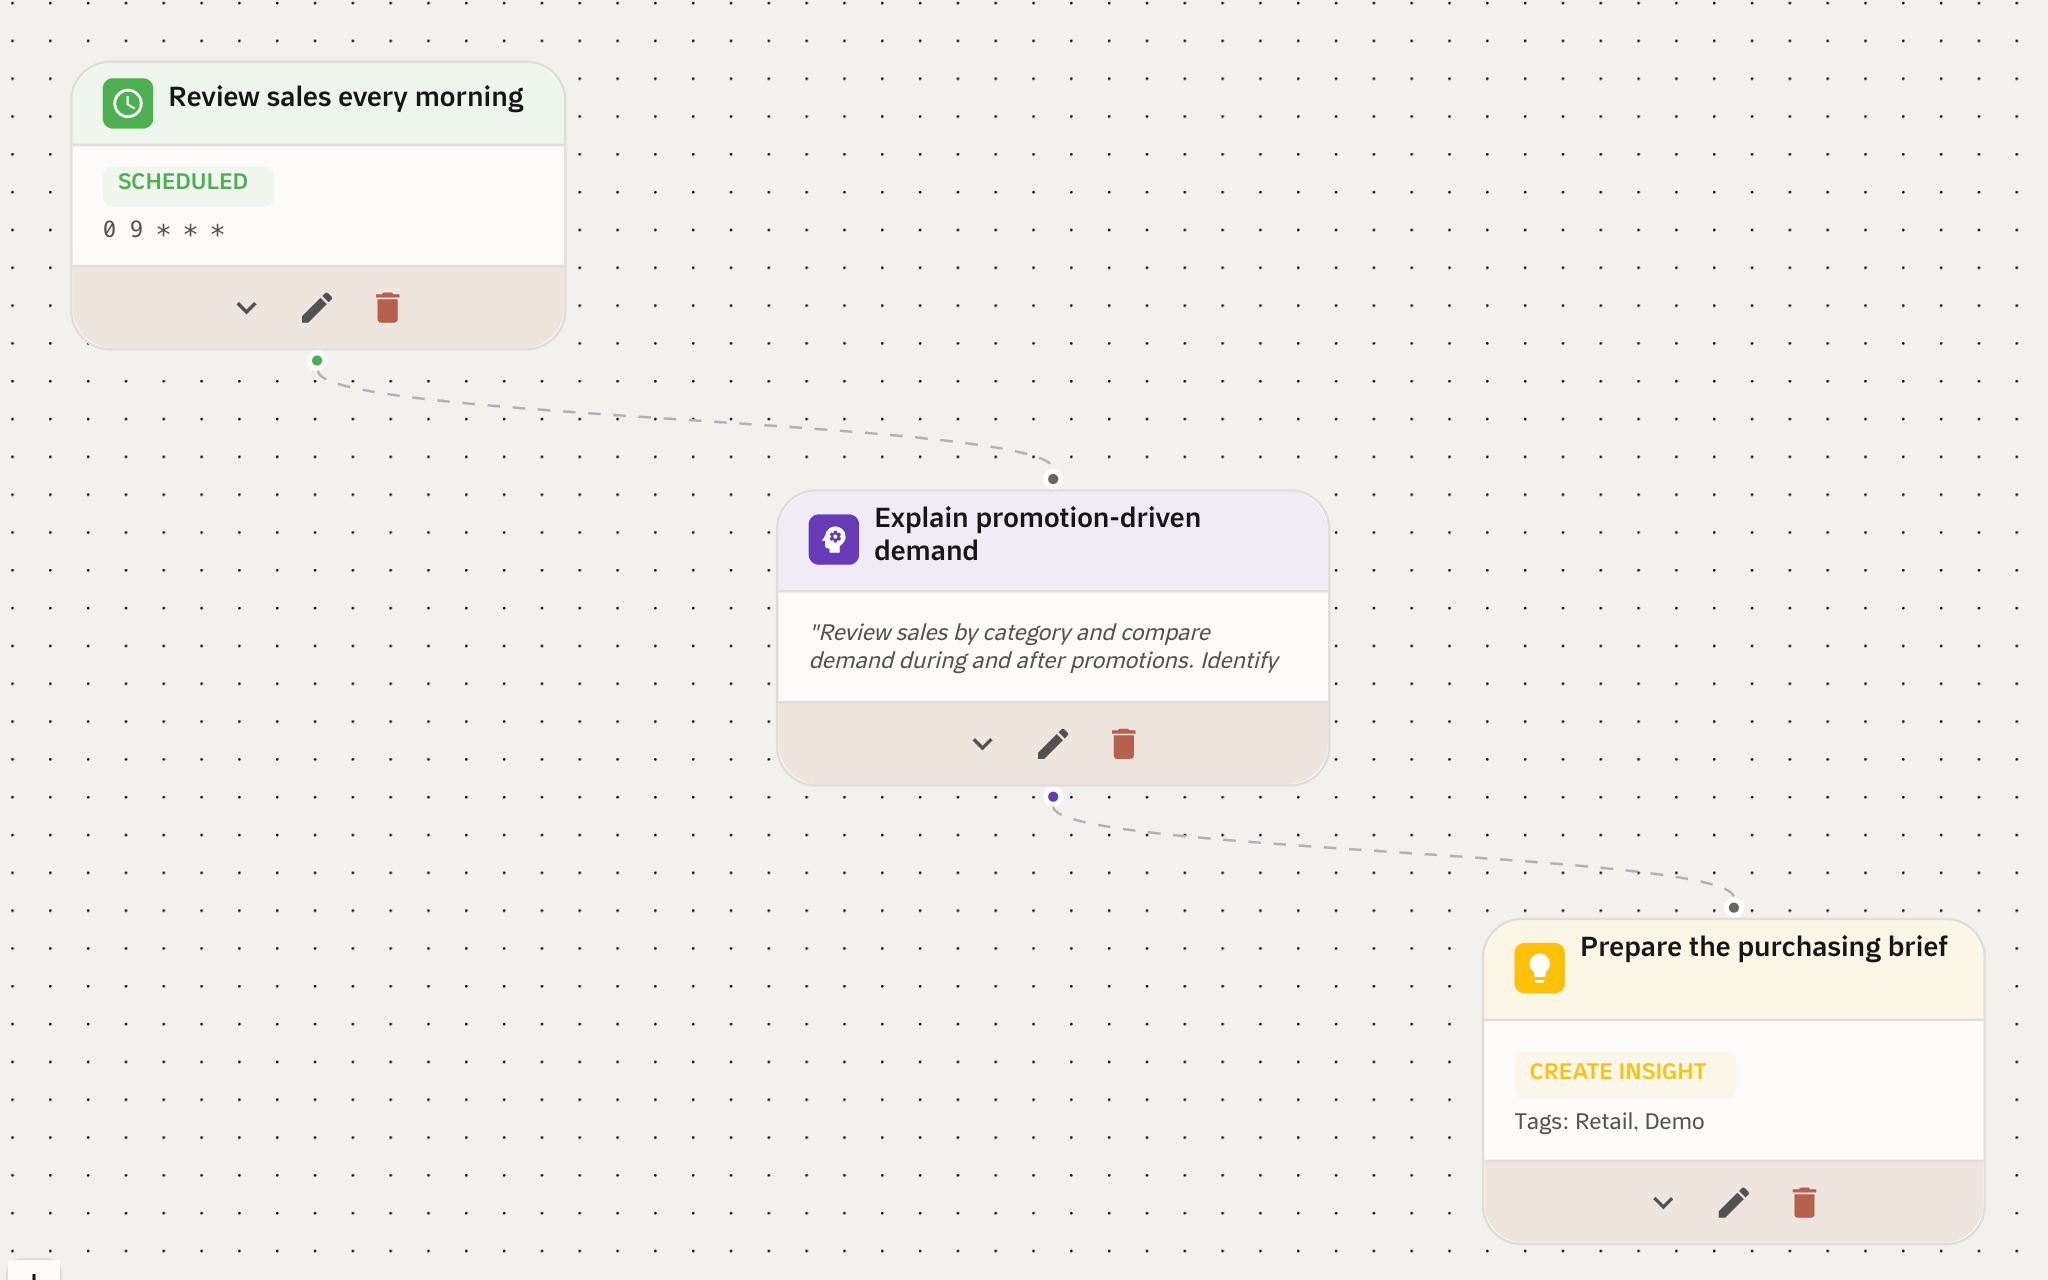
Your weekly analysis, already scheduled.
Turn a question your team asks every week into a scheduled review. Set when it runs, add the analysis step, and choose the output, such as a purchasing summary.
- Schedule the review your team repeats every week.
- Get the result as a report or summary the team can act on.
What a Qubit plan includes
- Everyday analysis
- Data chat, dashboards, shared metric definitions, scheduled workflows, and reports. Connection counts and usage limits depend on your plan.
- Automatic insights
- Qubit flags notable changes in your data, so you know where to look next.
- Embed, customize, and control
- Dashboard and agent embedding, your branding, custom and REST connectors, data permissions, row filters, member access review, and dedicated support.
See Qubit answer a question you already ask.
Connect a source and ask a question your team answers every week. See how Qubit handles the analysis, monitoring, and scheduled workflows.