
Never be the last to notice change.
AI decision intelligence that finds changes before you ask. Investigate what matters and automate recurring analysis and reports.
Why did sales increase this month while profit stayed flat?
Sales system
Sales went up
Best-selling products drove sales growth
Purchase invoices
So did costs
Those same products cost more to buy
Higher costs absorbed the growth.
Qubit connected sales to purchasing costs: higher costs absorbed the sales growth, leaving profit flat.
Suggested next step
Review purchasing costs and supplier terms for your best-selling products.
Qubit is connecting the evidence
Read the sources
Compare the figures
Find the cause
Explain the next step
Illustrative example0.0s
Trusted by teams that depend on their data.









140+ connectors.
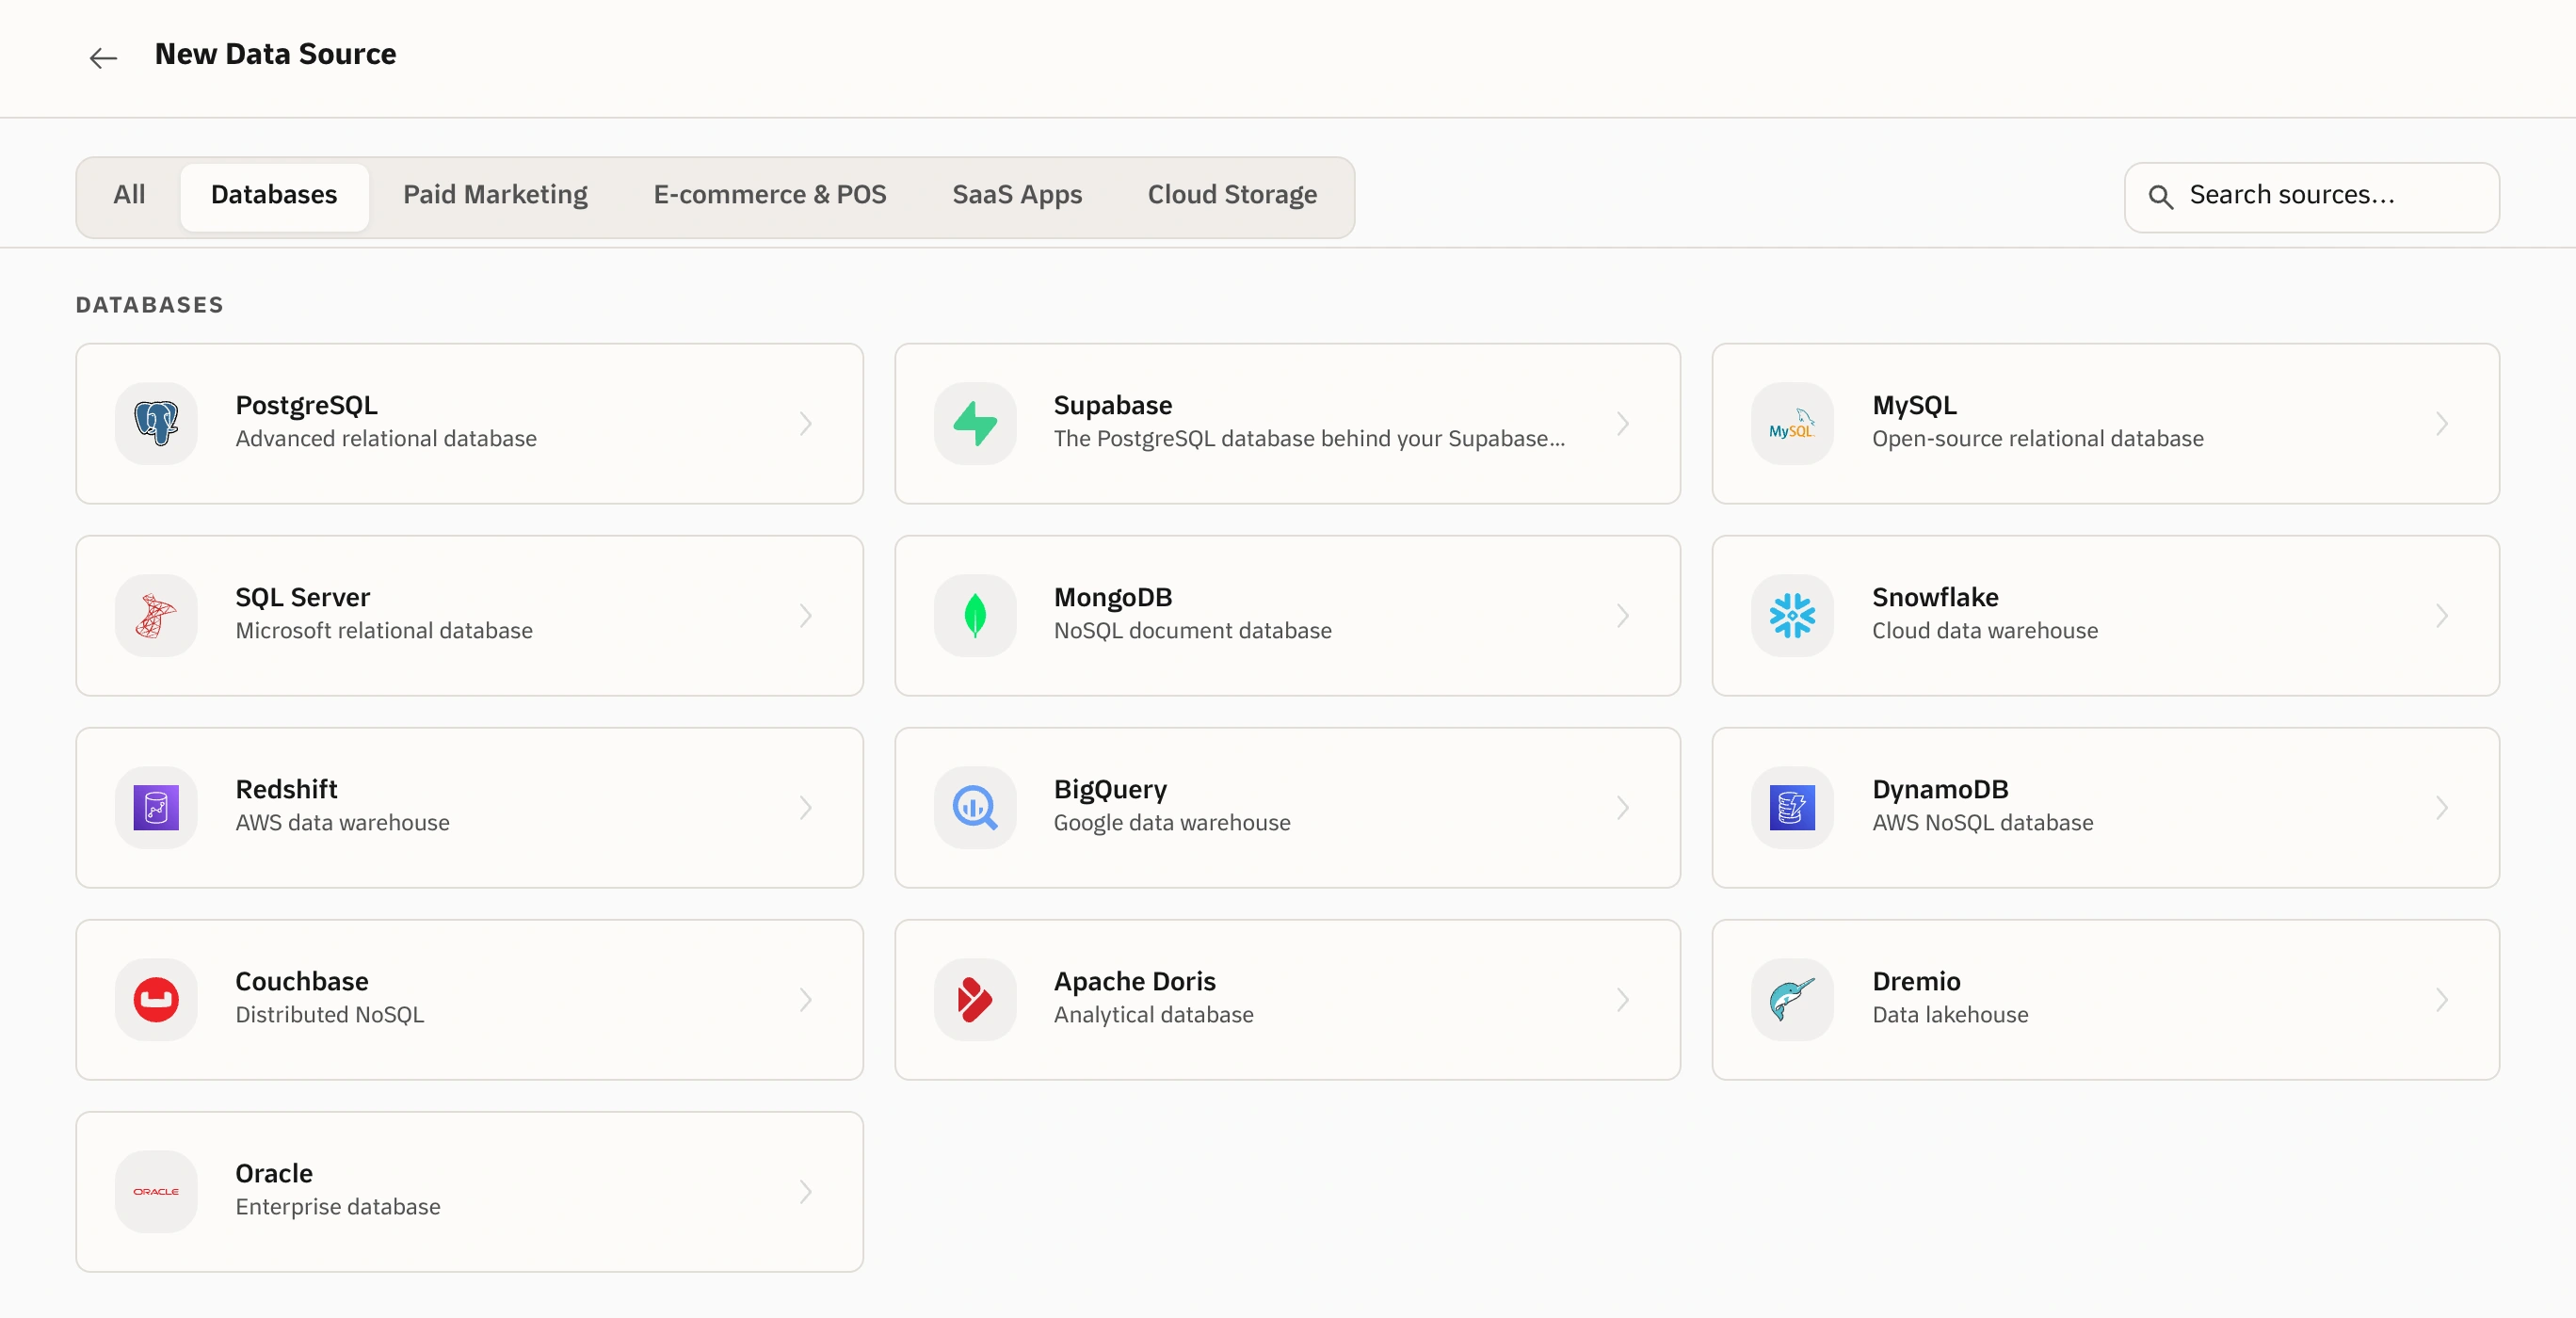
Start with the data you already have.
PostgreSQL
BigQuery
Snowflake
MySQL
Excel & CSV
From a finding to your next decision.
Explore the evidence, build a shared view, and prepare the next report in one place.
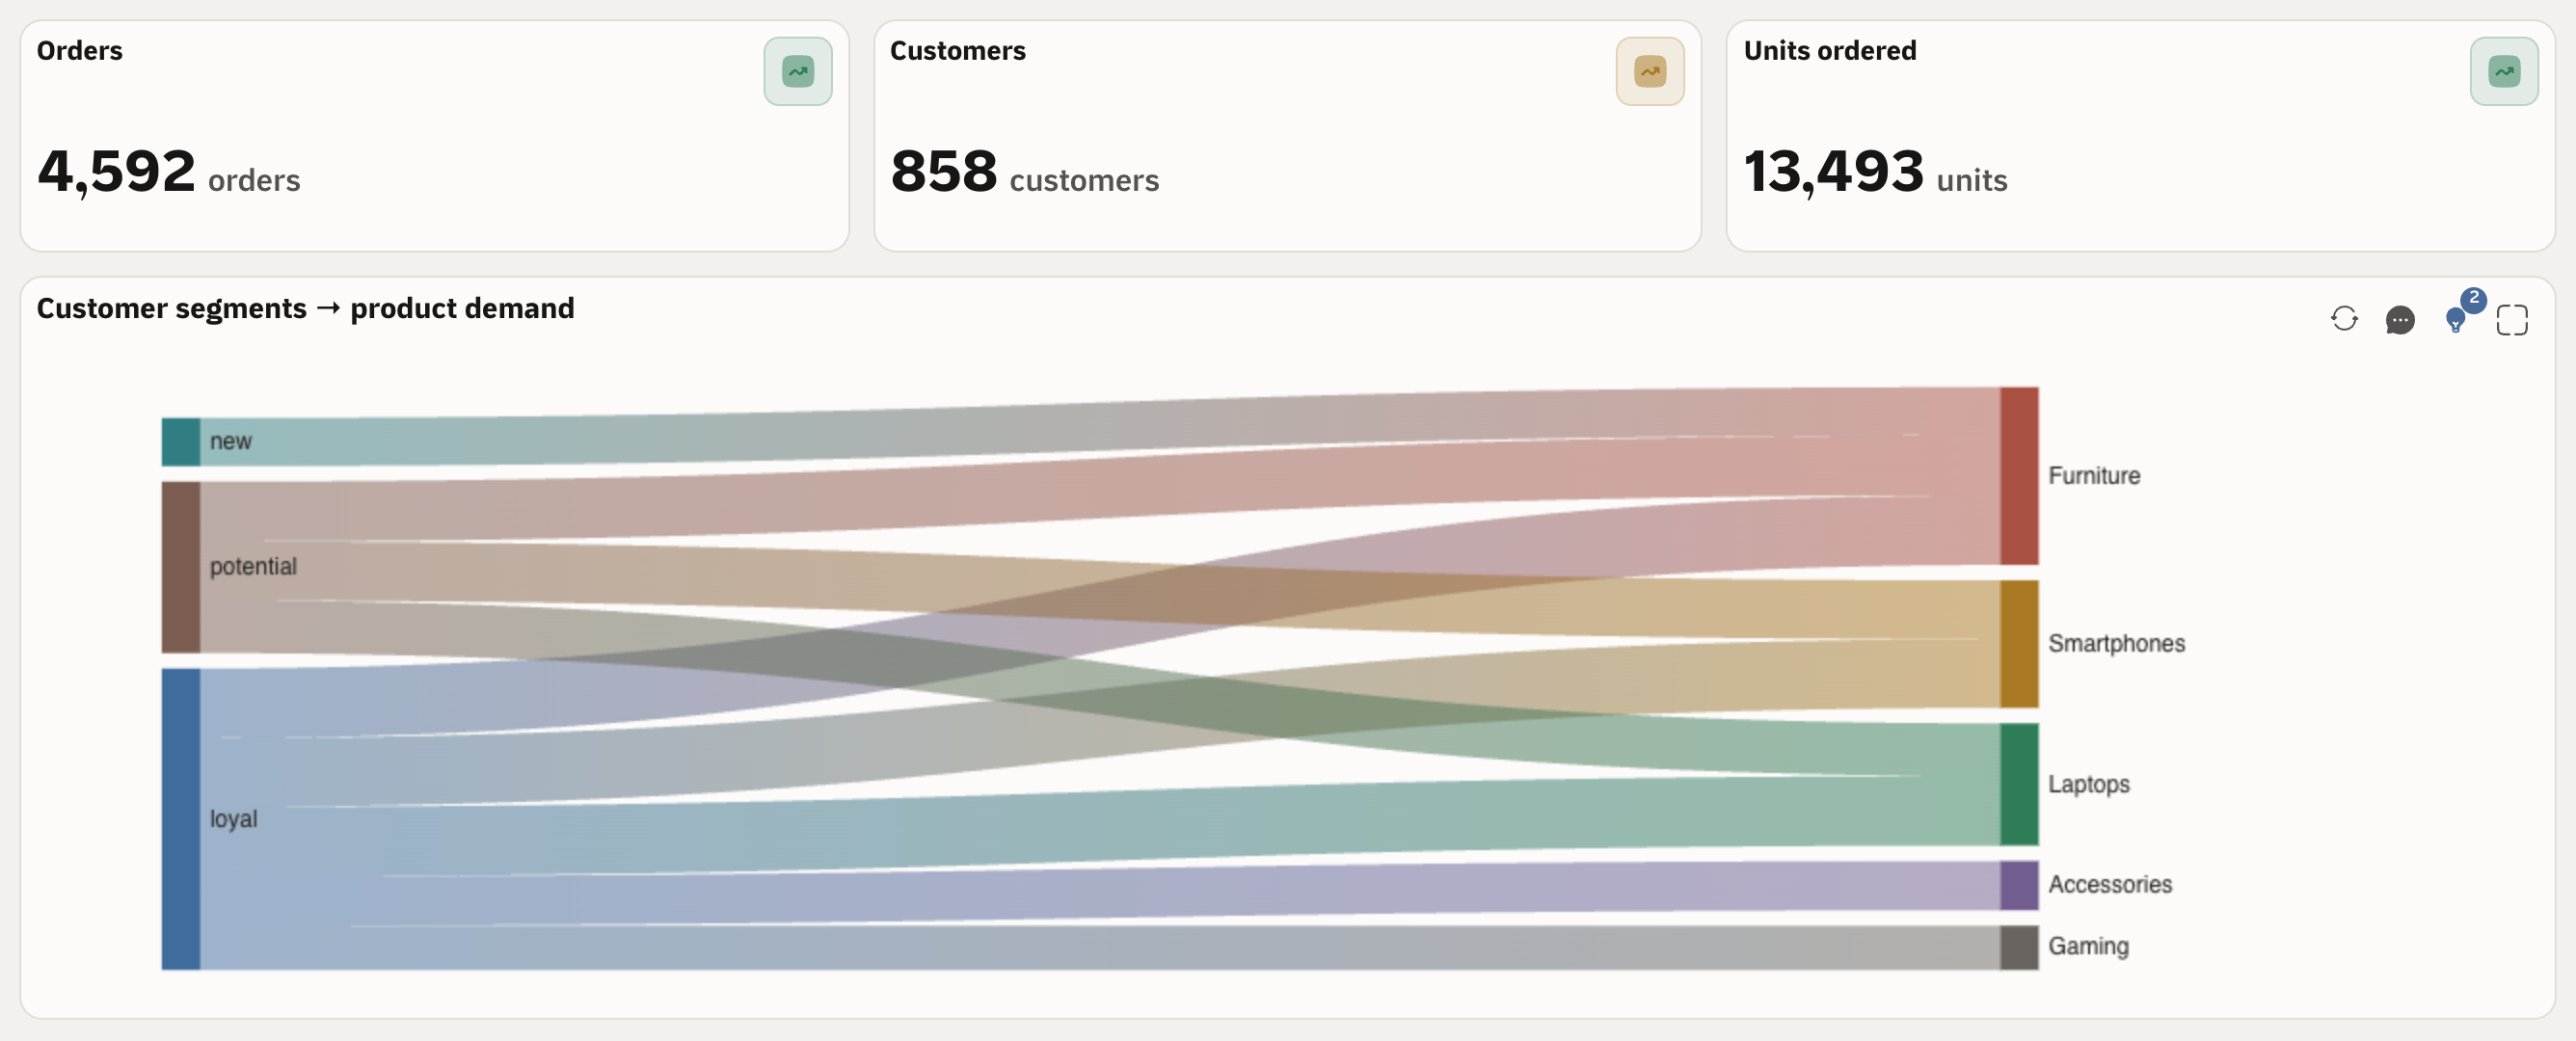
The numbers that matter, together.
Build dashboards with AI to track performance and explore the patterns behind your metrics.
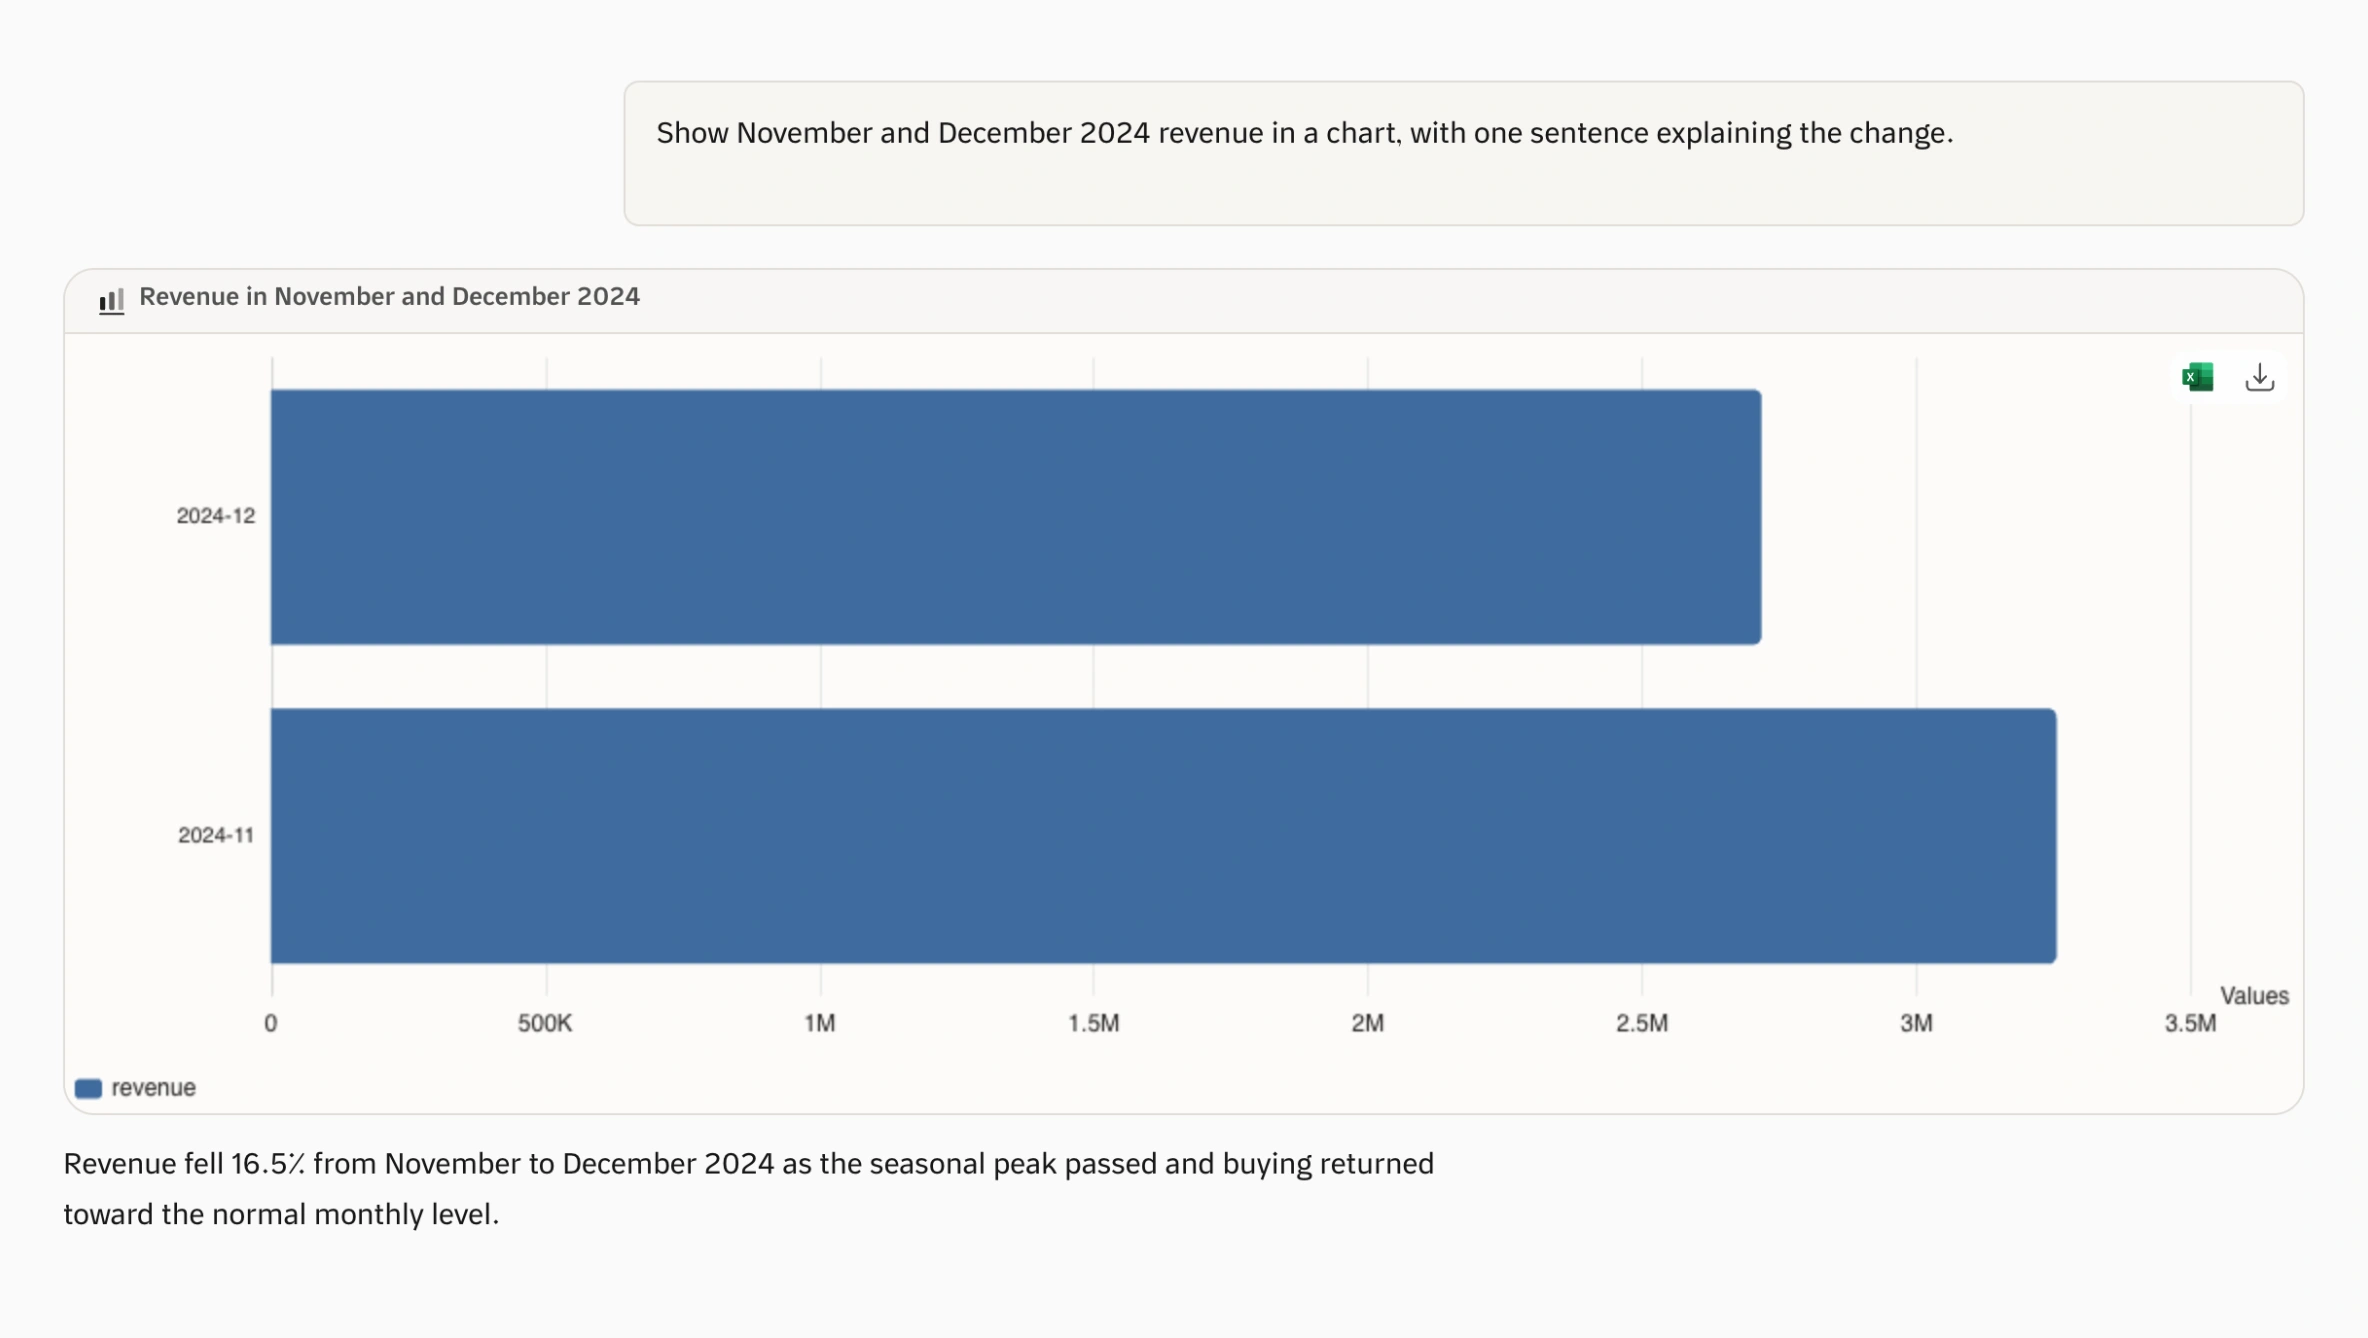
A closer look at what changed.
Investigate in plain language. Explore a chart, ask follow-up questions, and understand what drives the result.
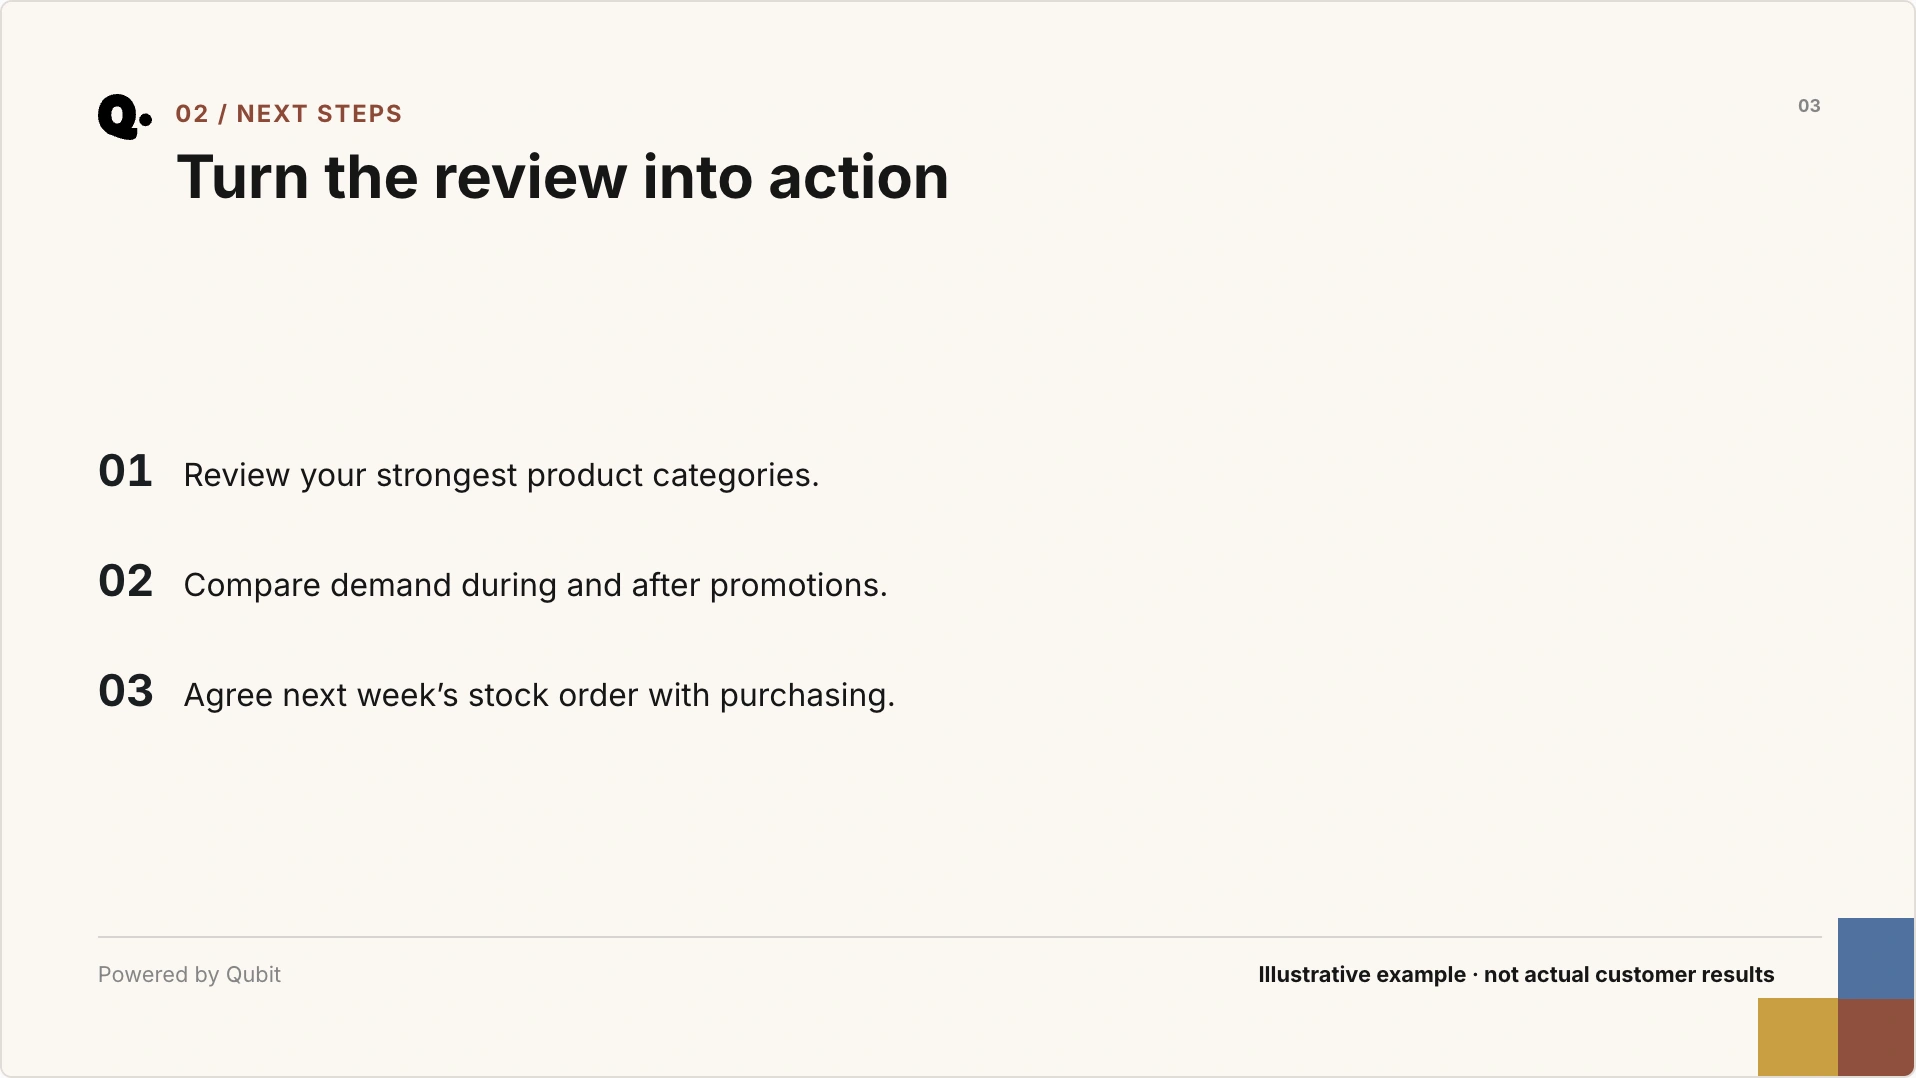
Analysis ready for your next meeting.
Turn findings into a structured PowerPoint report your team can review and share.
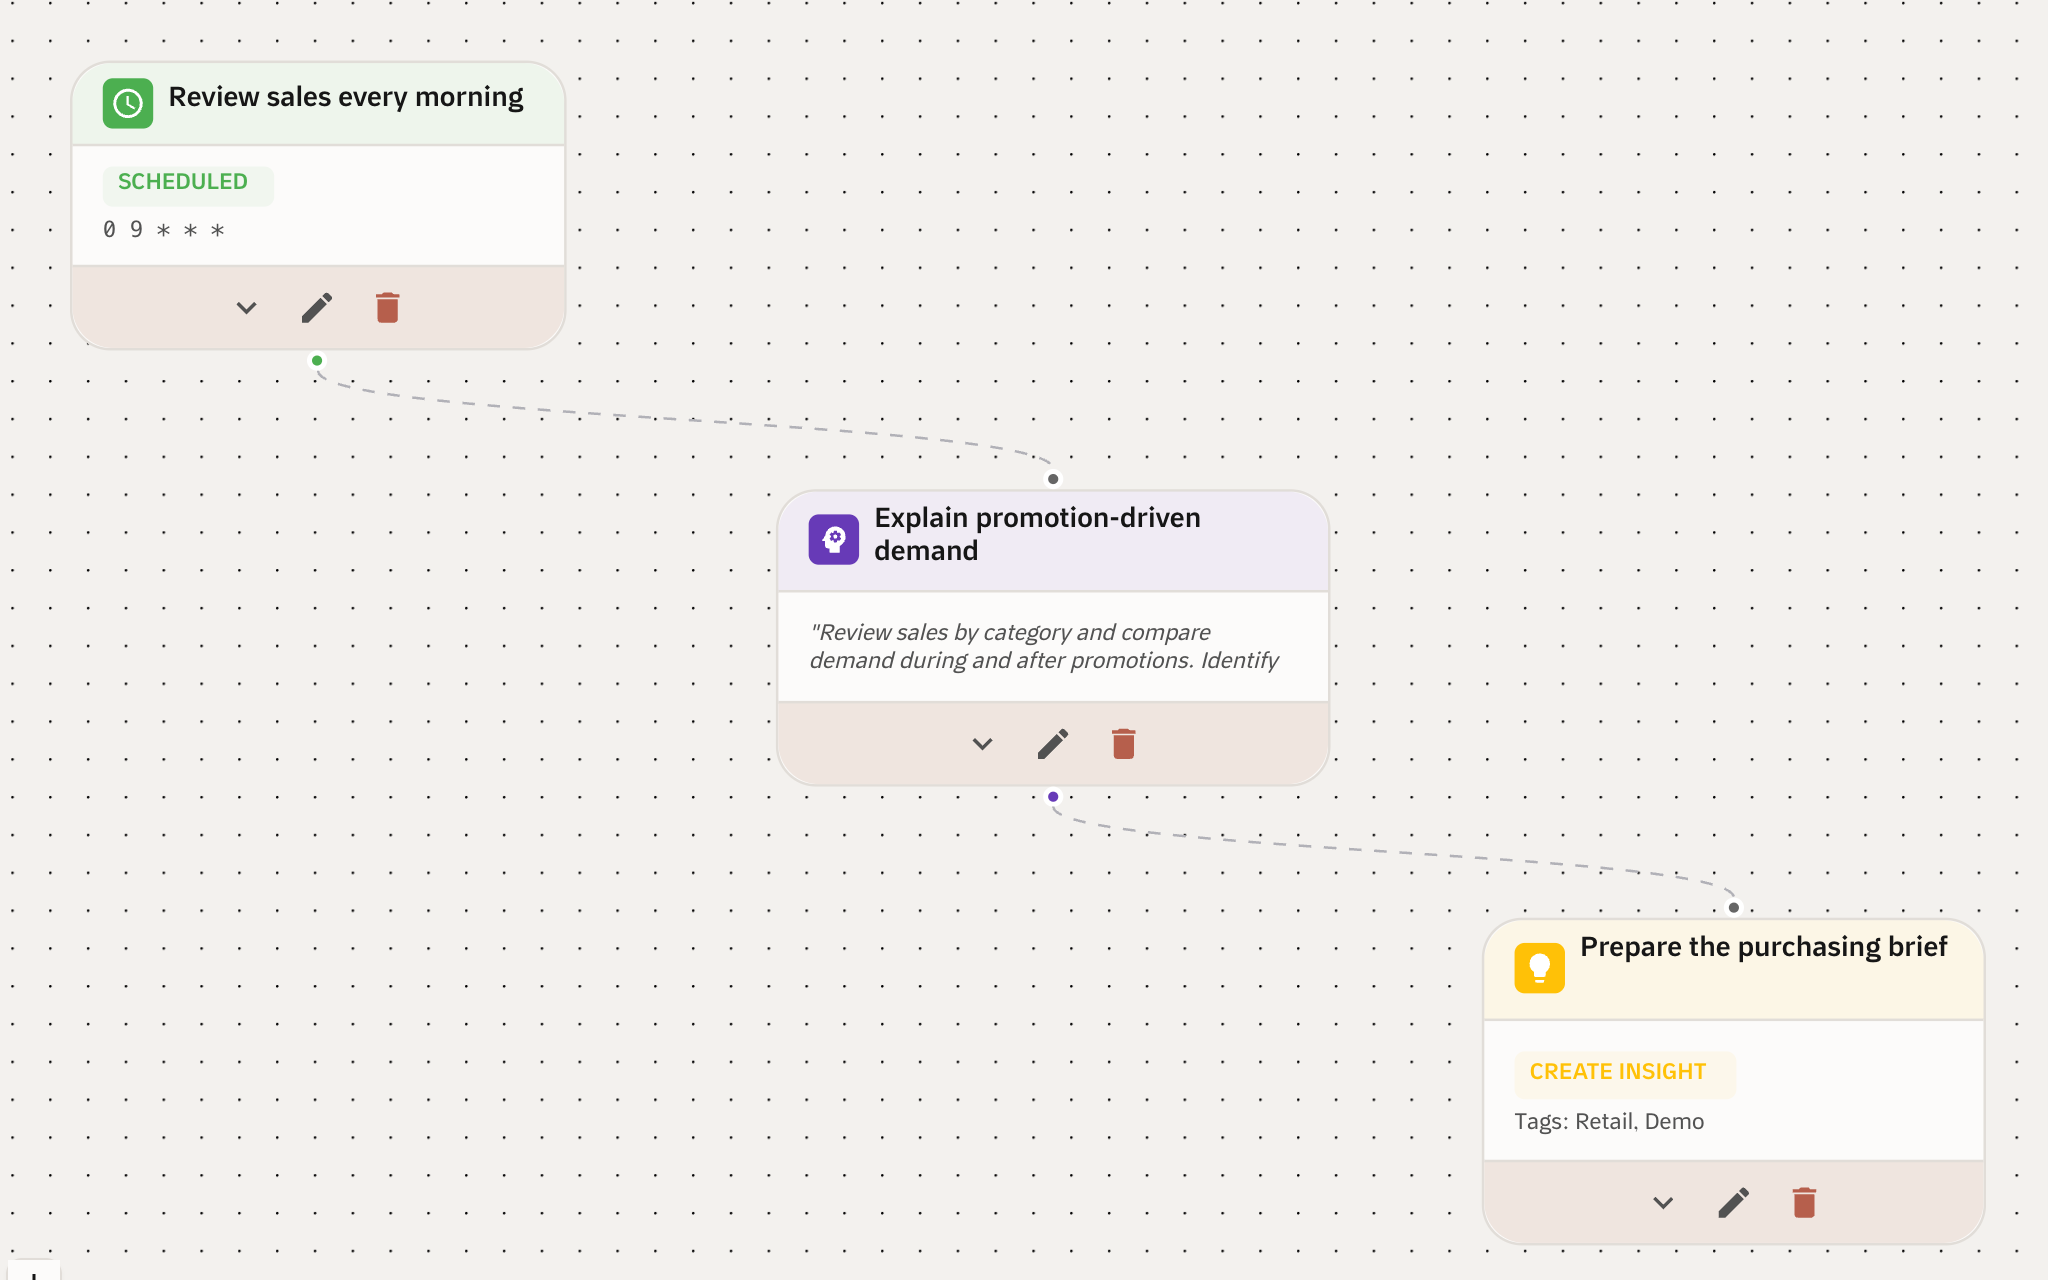
Investigation and reporting, on a schedule.
Connect multiple steps to review performance, investigate changes, and prepare a recurring brief.
Your existing data, connected.
Connect 140+ data sources, from databases and business tools to spreadsheets.
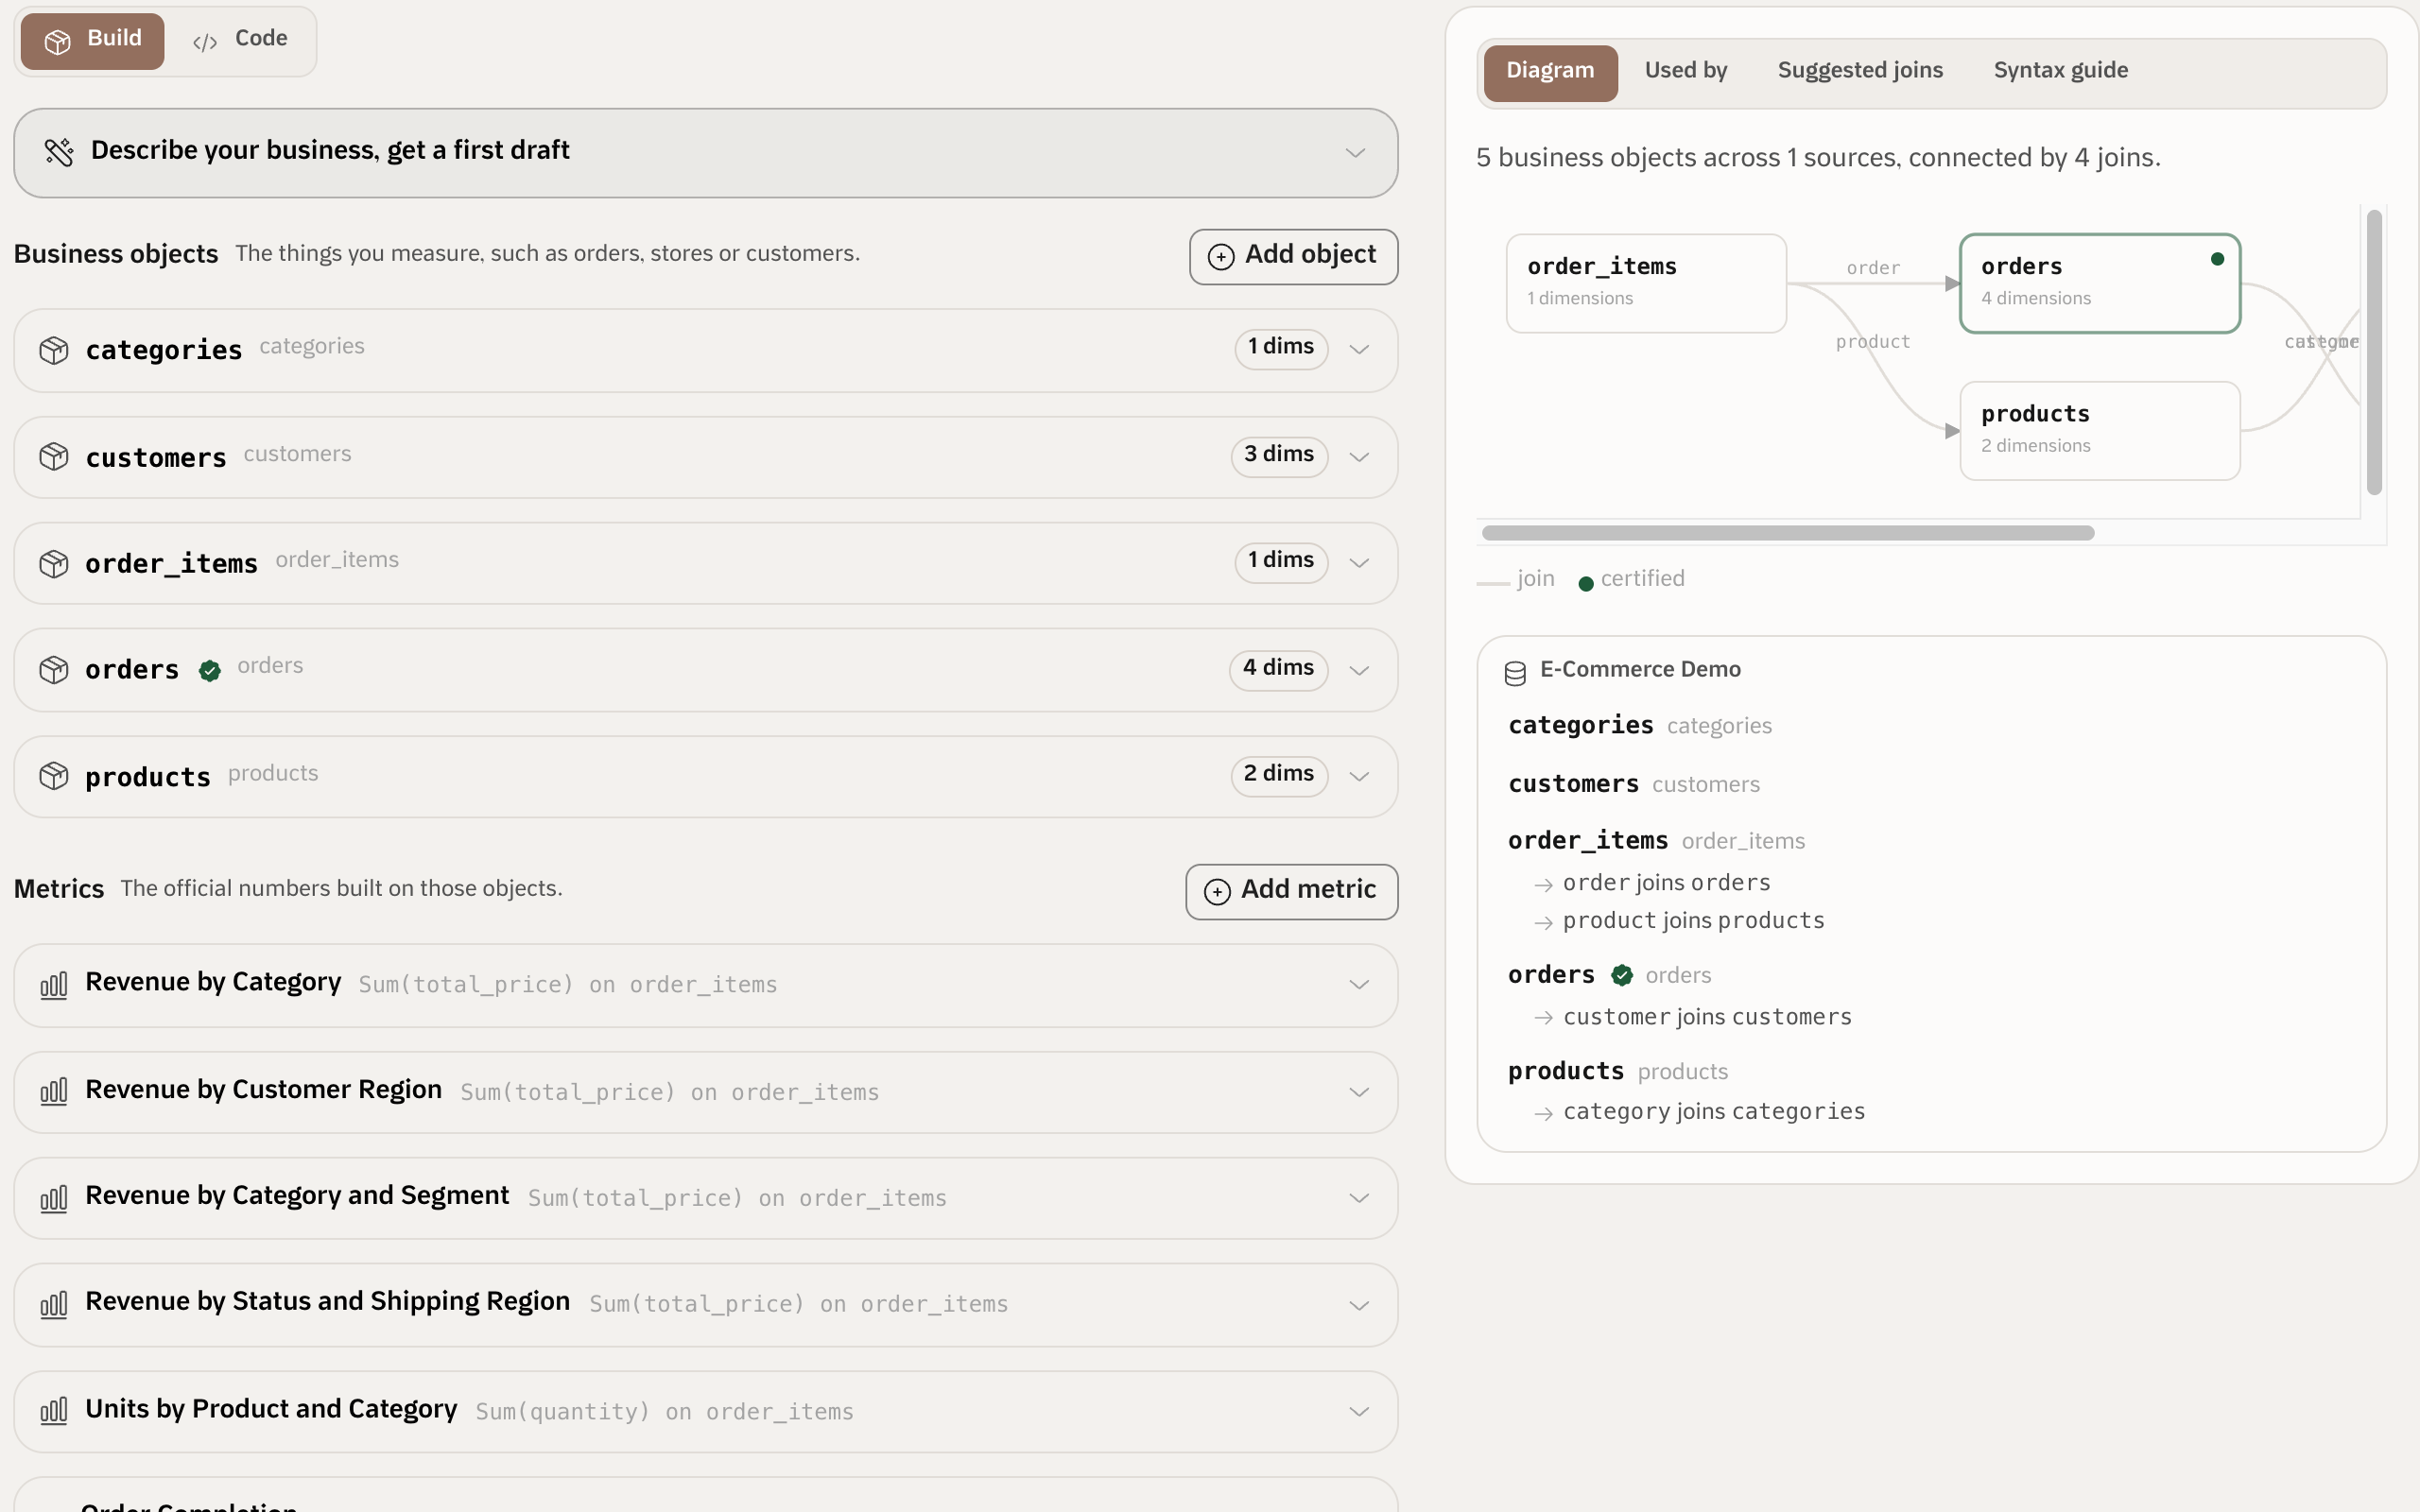
The same meaning behind every metric.
Define business metrics and table relationships so people and AI work from shared definitions.
Selected product views with sample data.
View full-size image ↗Analysis that keeps working for you.
Discover changes automatically. Give recurring work a routine.
Automatic insights
“What changed while we weren’t looking?”
Qubit surfaces trends and anomalies as your data refreshes, with supporting charts and suggested next steps.
Connected AI workflows
“Review margins, investigate changes, and prepare our Monday brief.”
Connect investigation, analysis, and reporting in a scheduled workflow. Give your team a useful starting point every week.
Business context. Clear boundaries.
Shared definitions for your AI. Controlled access for your team.
Shared business definitions
Define metrics and table relationships once in a semantic layer, so each analysis starts with the same understanding of your data.
Row-level security
Control which rows each role can access. Give people the answers they need within the boundaries you set.
Read-only data access
Analyze connected data with read-only queries. Keep analysis separate from changes to your source systems.
Workspace roles and audit logs
Manage who can do what, separate workspaces, and review activity with an audit trail.
Make your next decision clearer.
Connect your data. Find a change worth exploring.