
Qubit Decision Intelligence Platform
Answers behind the numbers.
Bring your business data together. Ask questions, build dashboards, and turn analysis into reports and recurring tasks.
140+ governed data connections
Arabic and English AI analysis
Reports, decks, and workflows from prompts
Saudi-hosted, private cloud, or on premise
Your daily work, in one platform.
Explore current Qubit screens: dashboards, answers from your data, editable reports, and scheduled follow-ups.


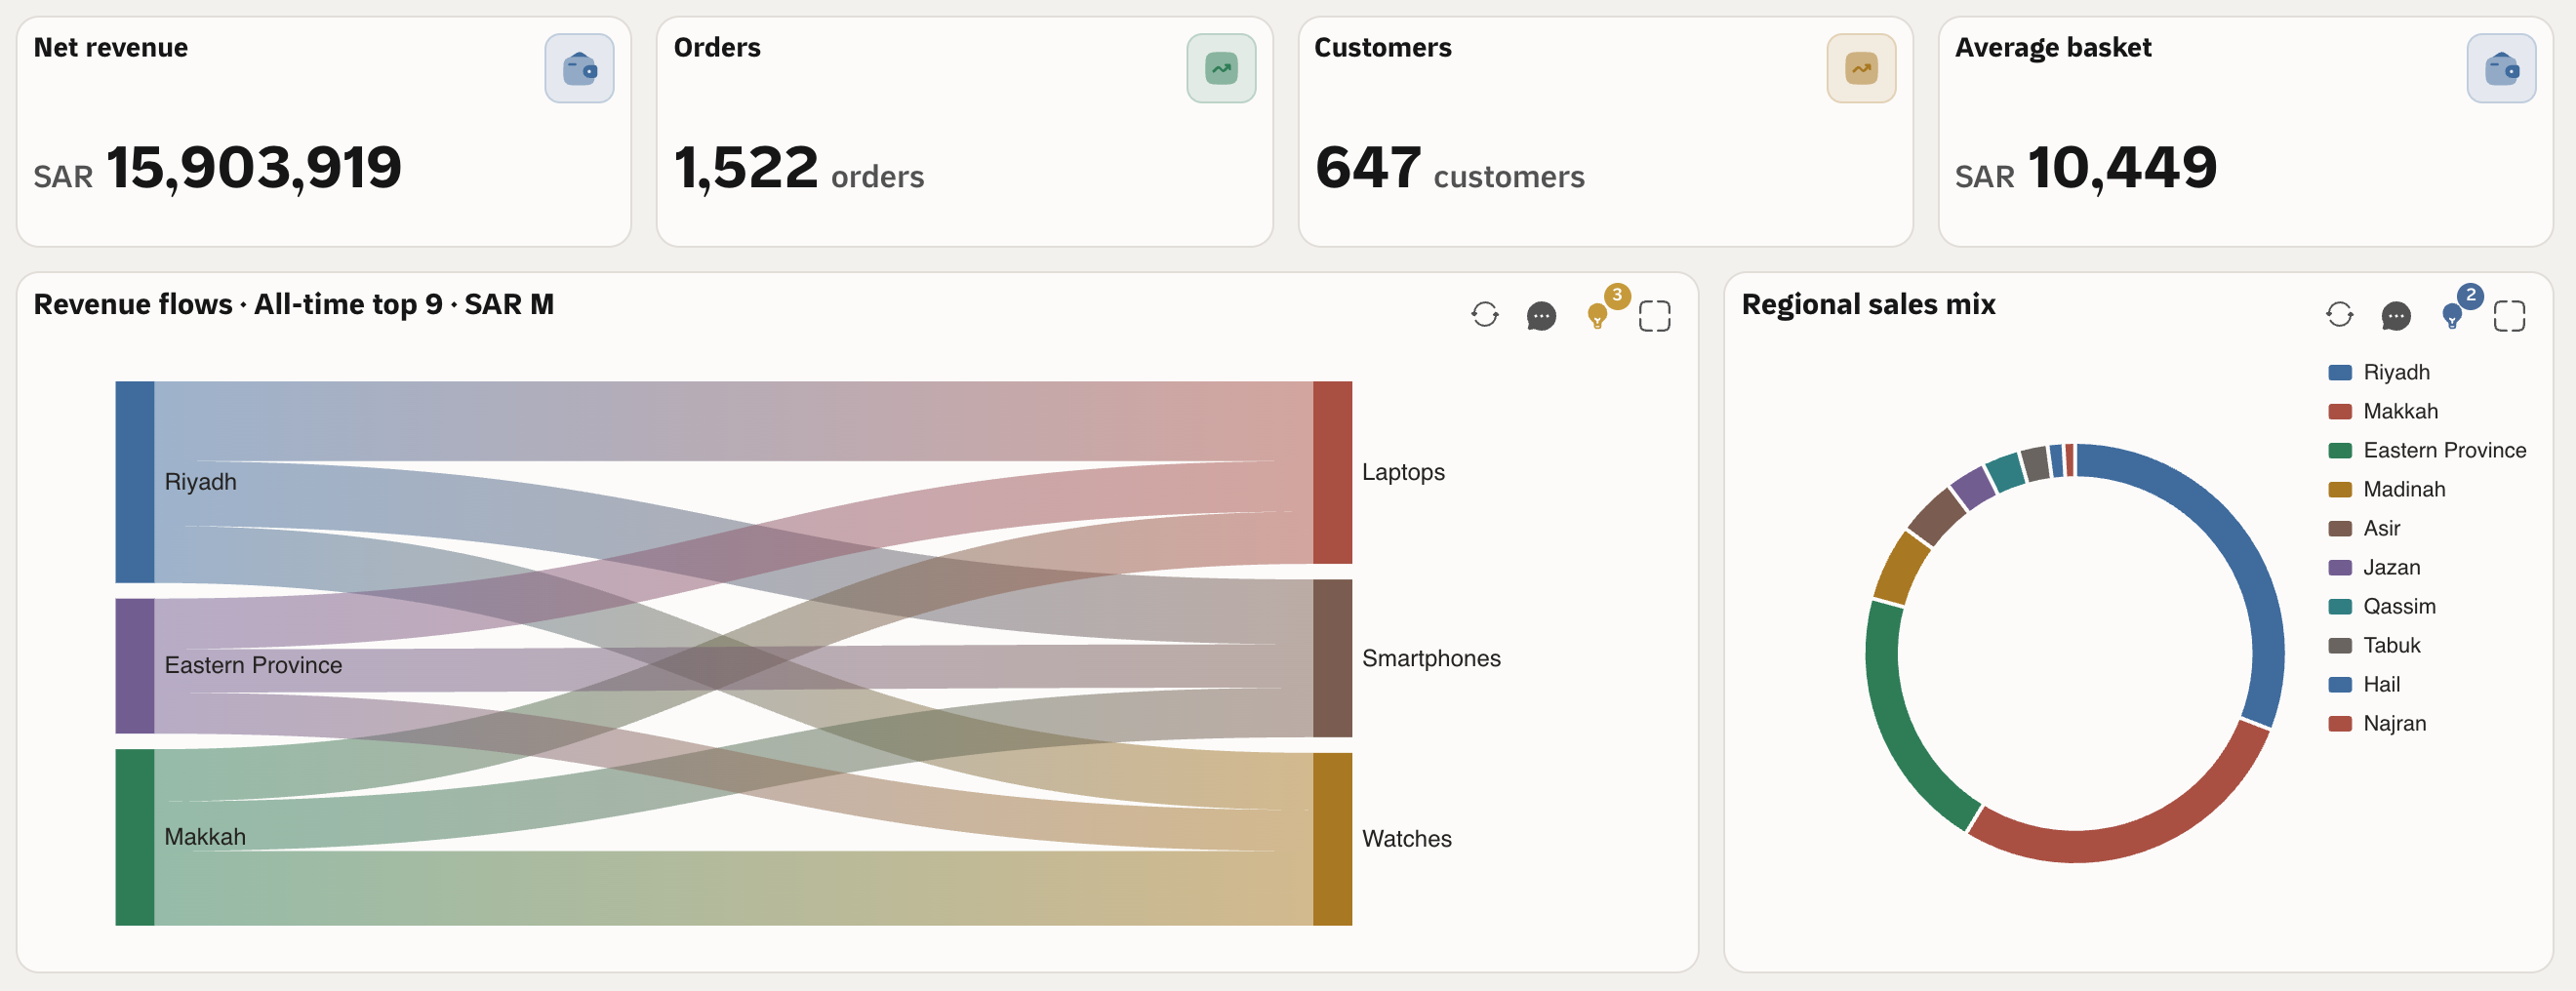
Revenue by region and product
Build a dashboard with AI, then compare revenue, customer demand and your strongest product categories.
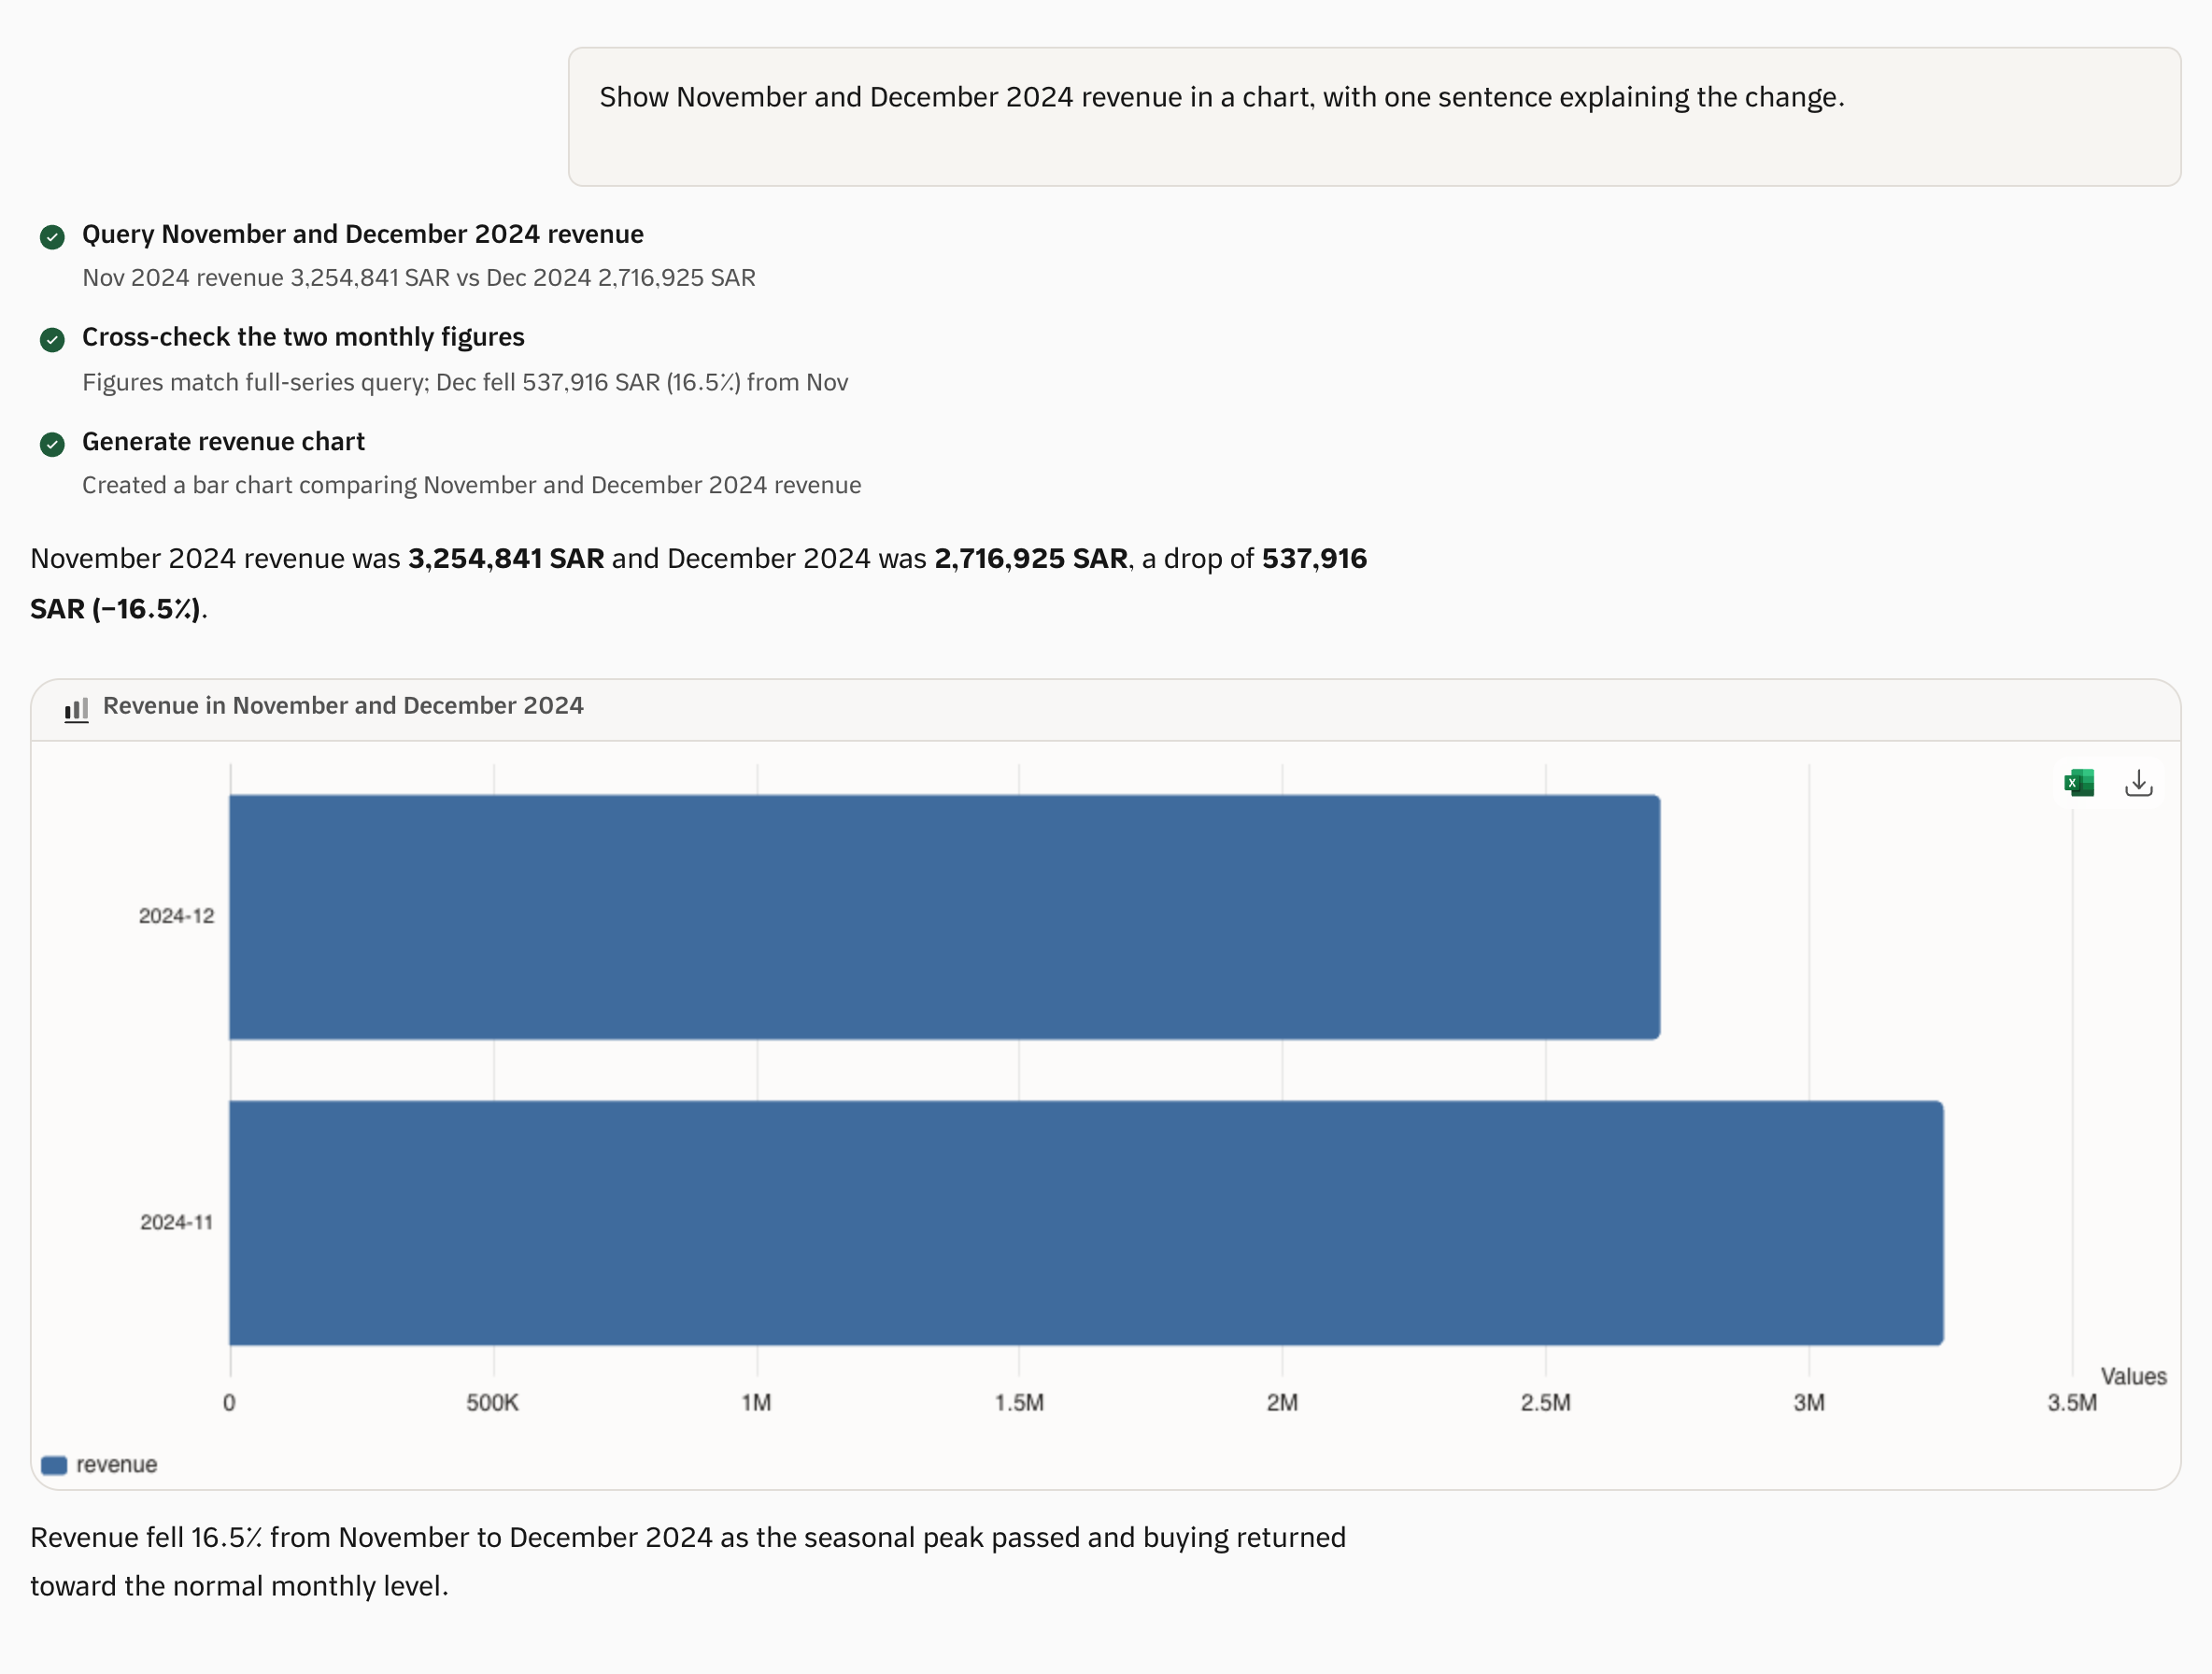
Charts and answers from a conversation
Ask a sales question. Qubit queries the data, checks the figures, and generates a chart you can discuss and export.
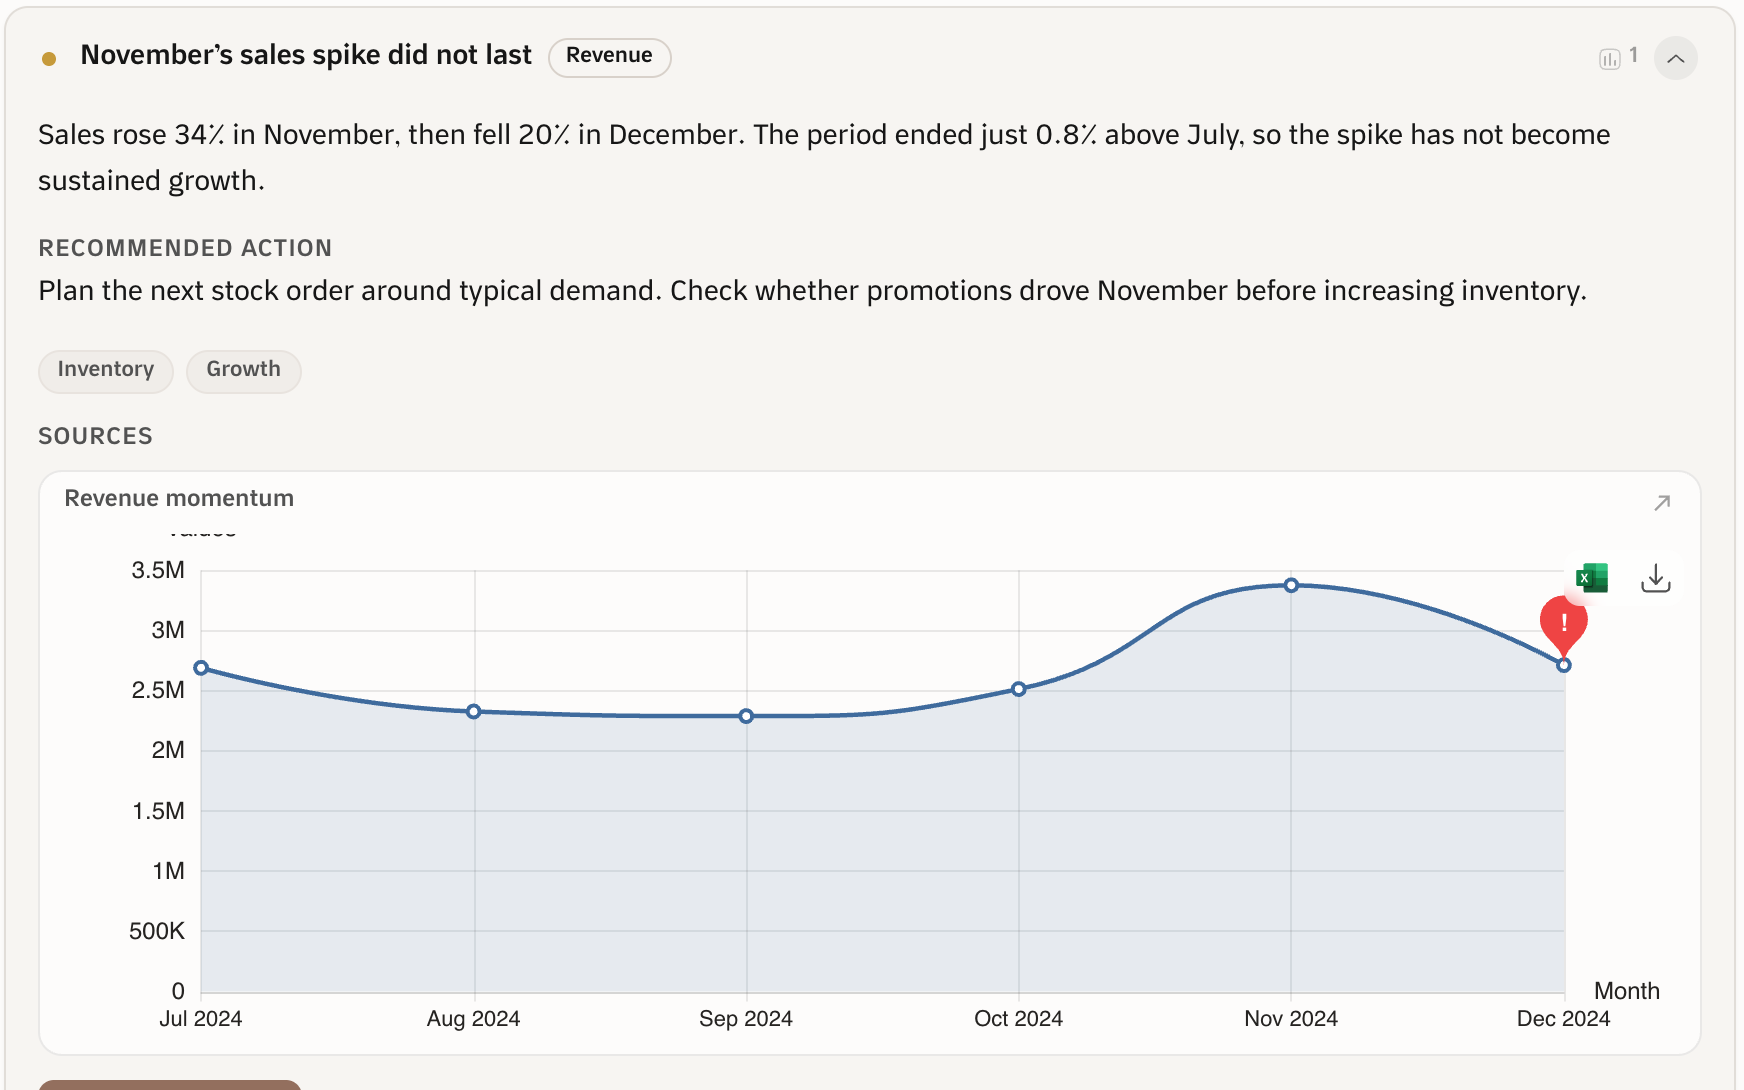
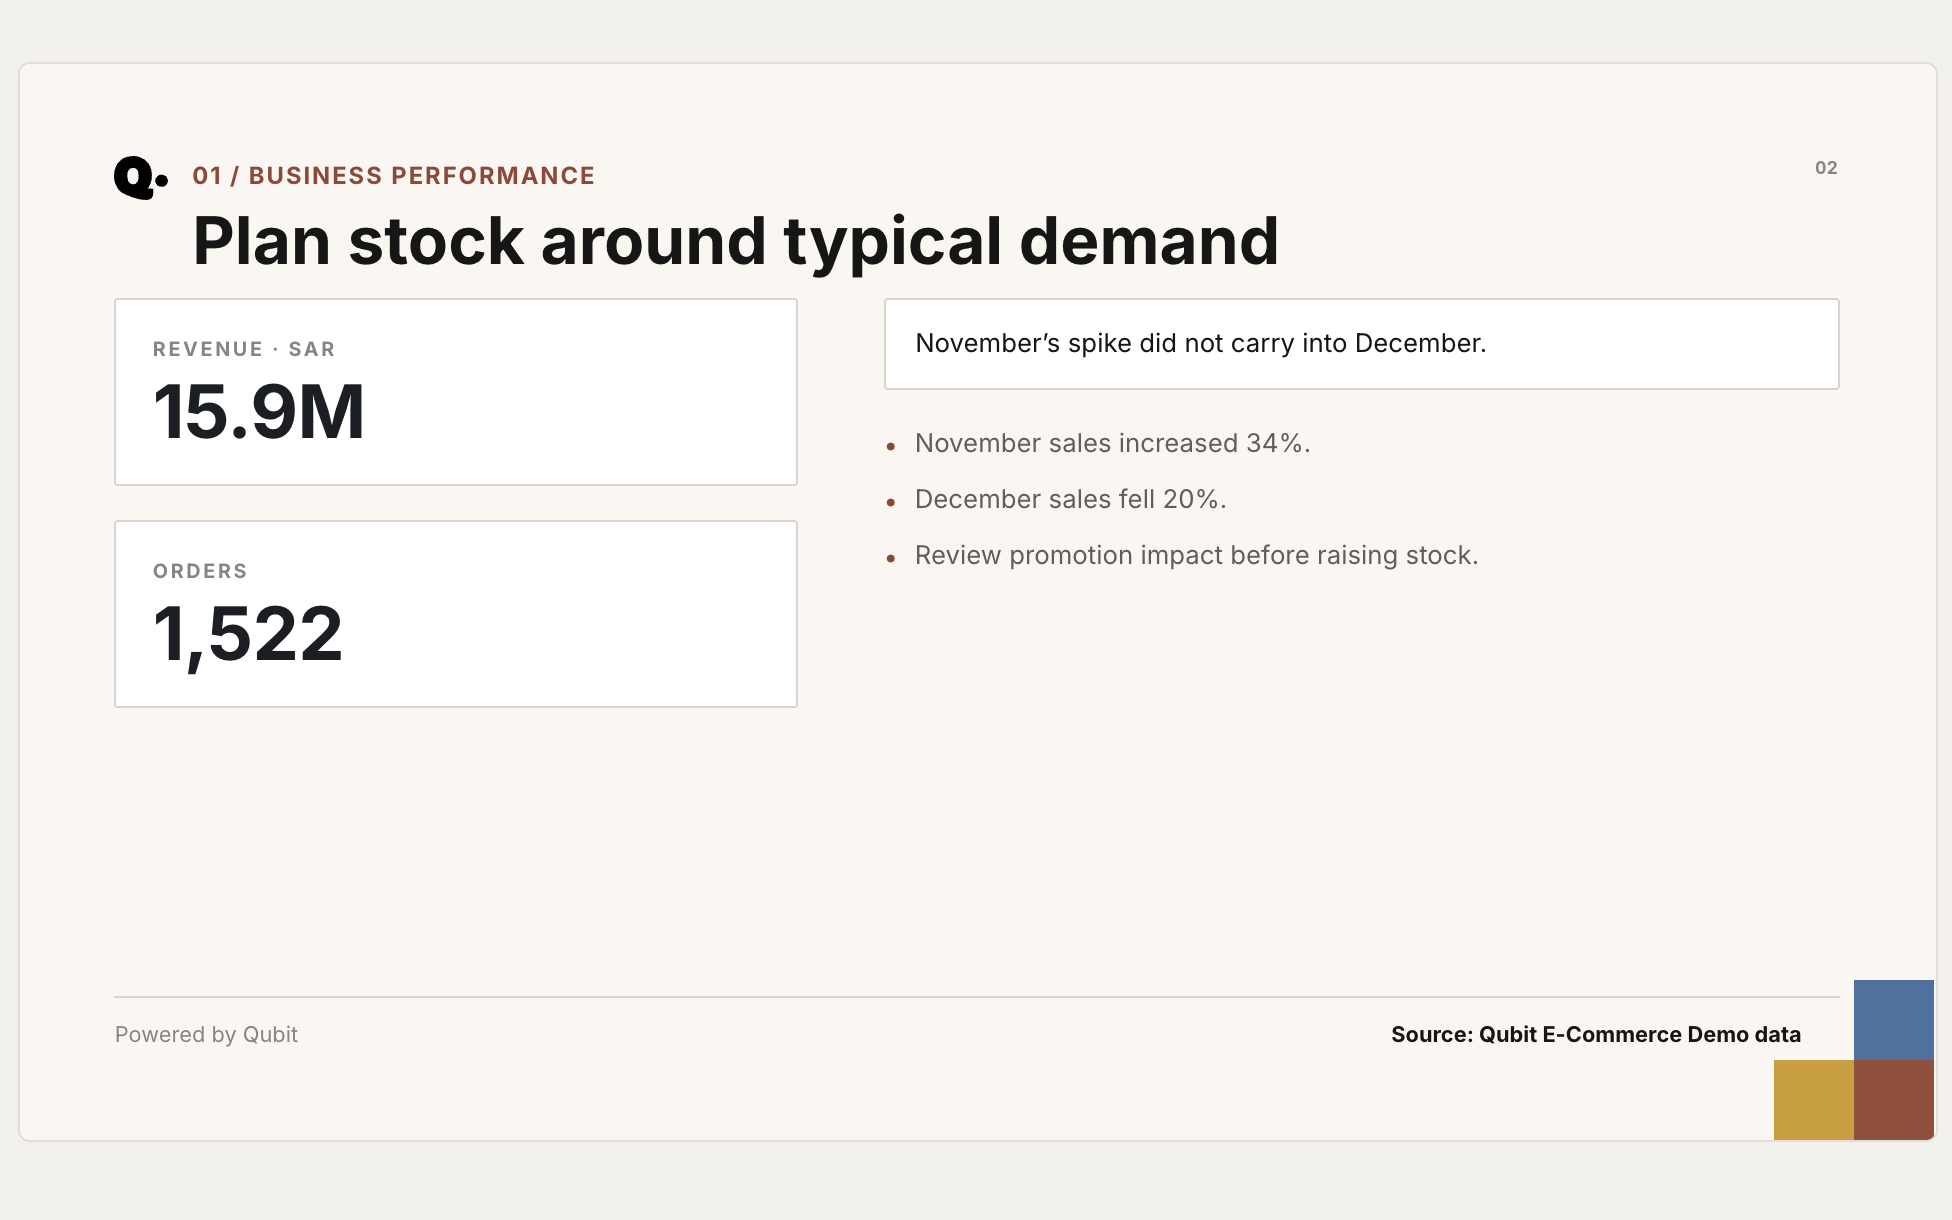
Sales changes explained, with a recommended next step
Understand what changed and review promotion impact before planning your next stock order.
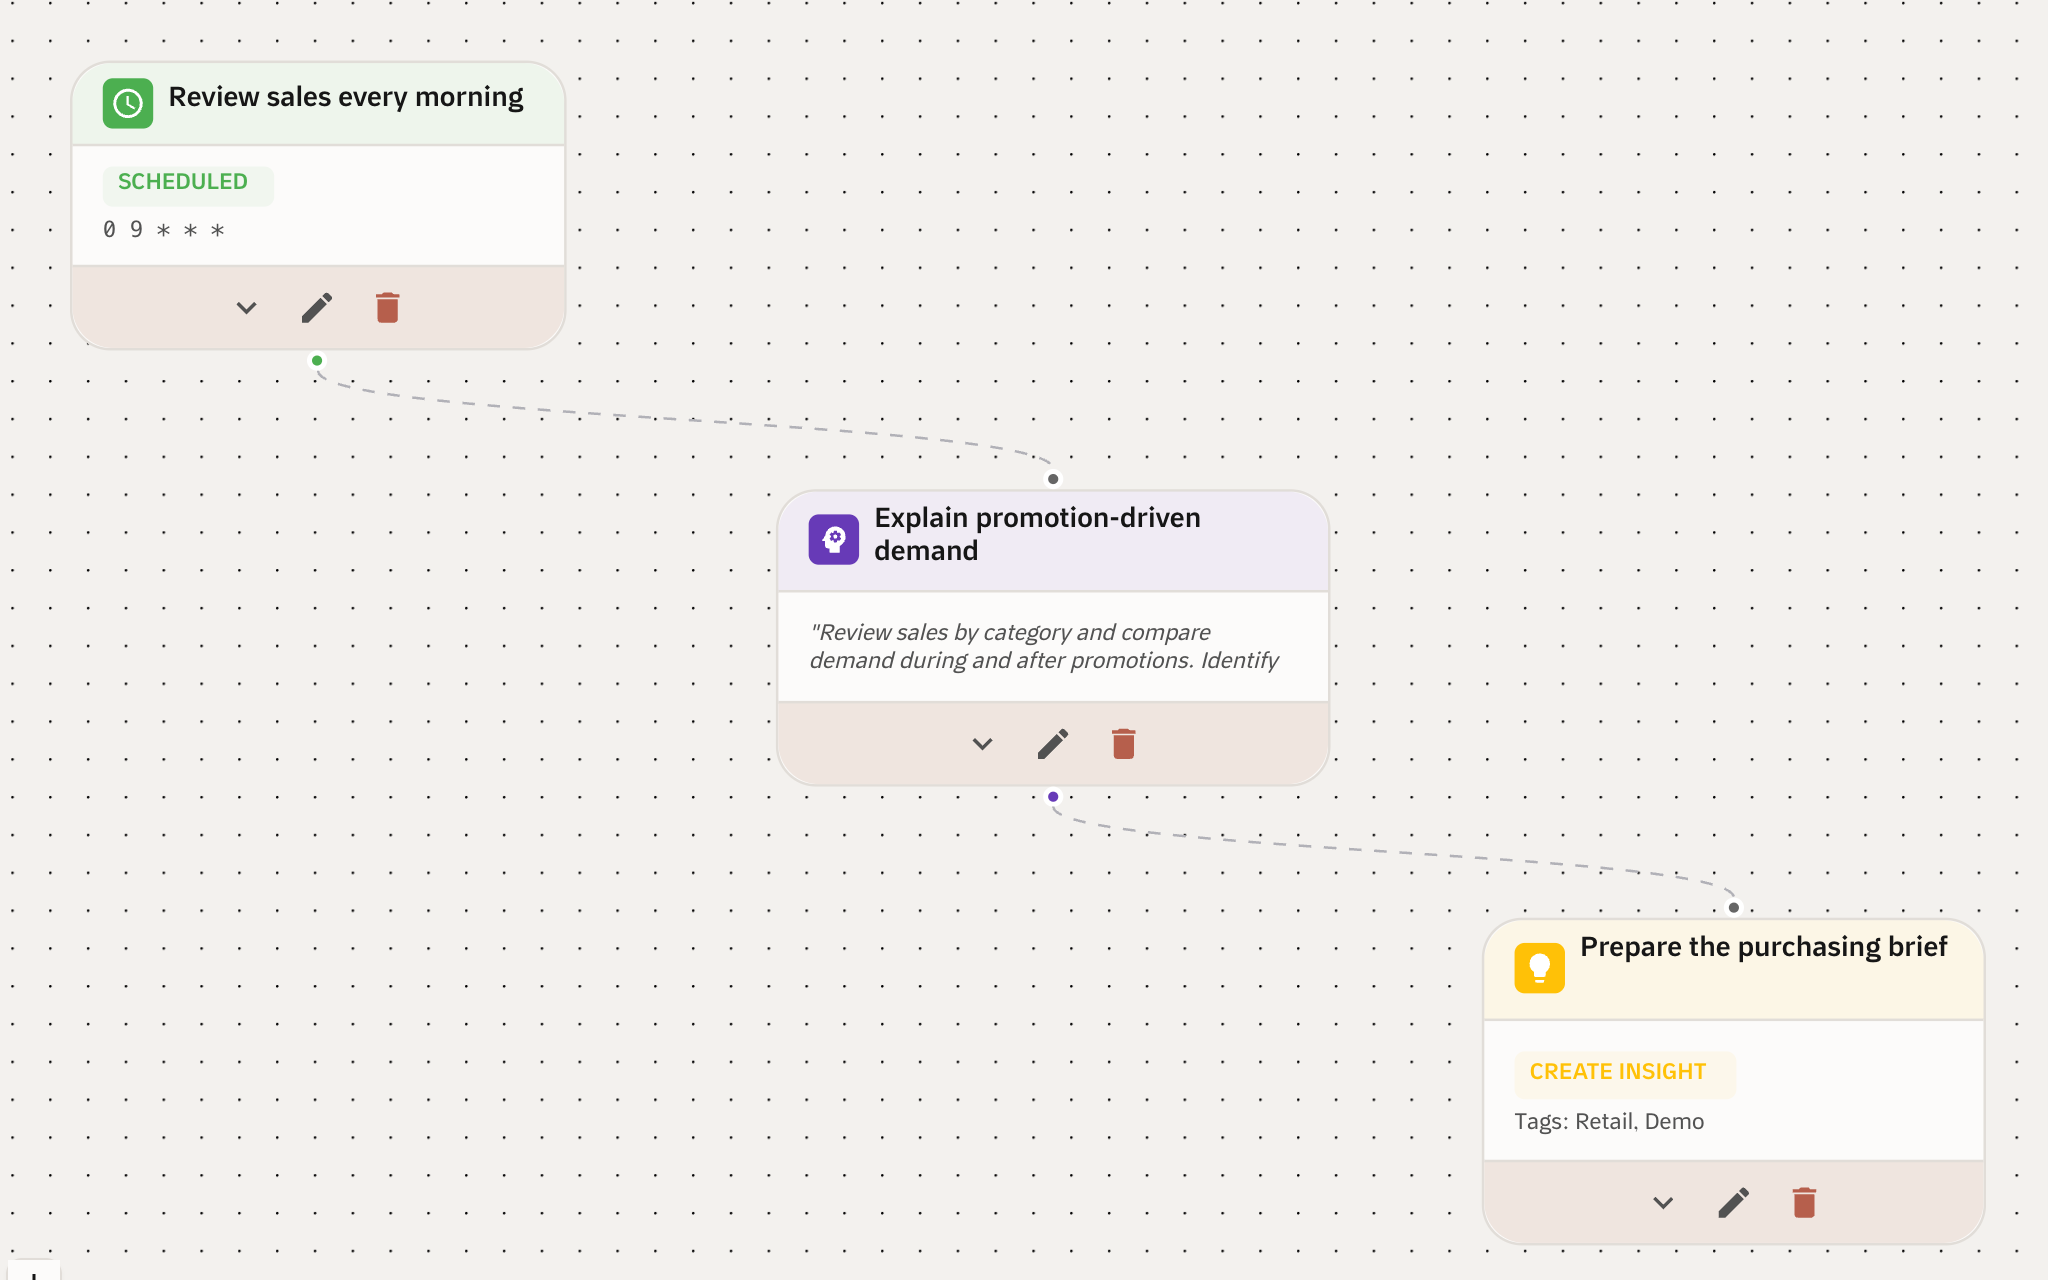
Daily sales review and purchasing brief
Schedule a sales review and prepare a focused brief for your purchasing team.
Editable PowerPoint business reports
Turn the findings into an editable PowerPoint report, with the numbers, the explanation and the next steps.
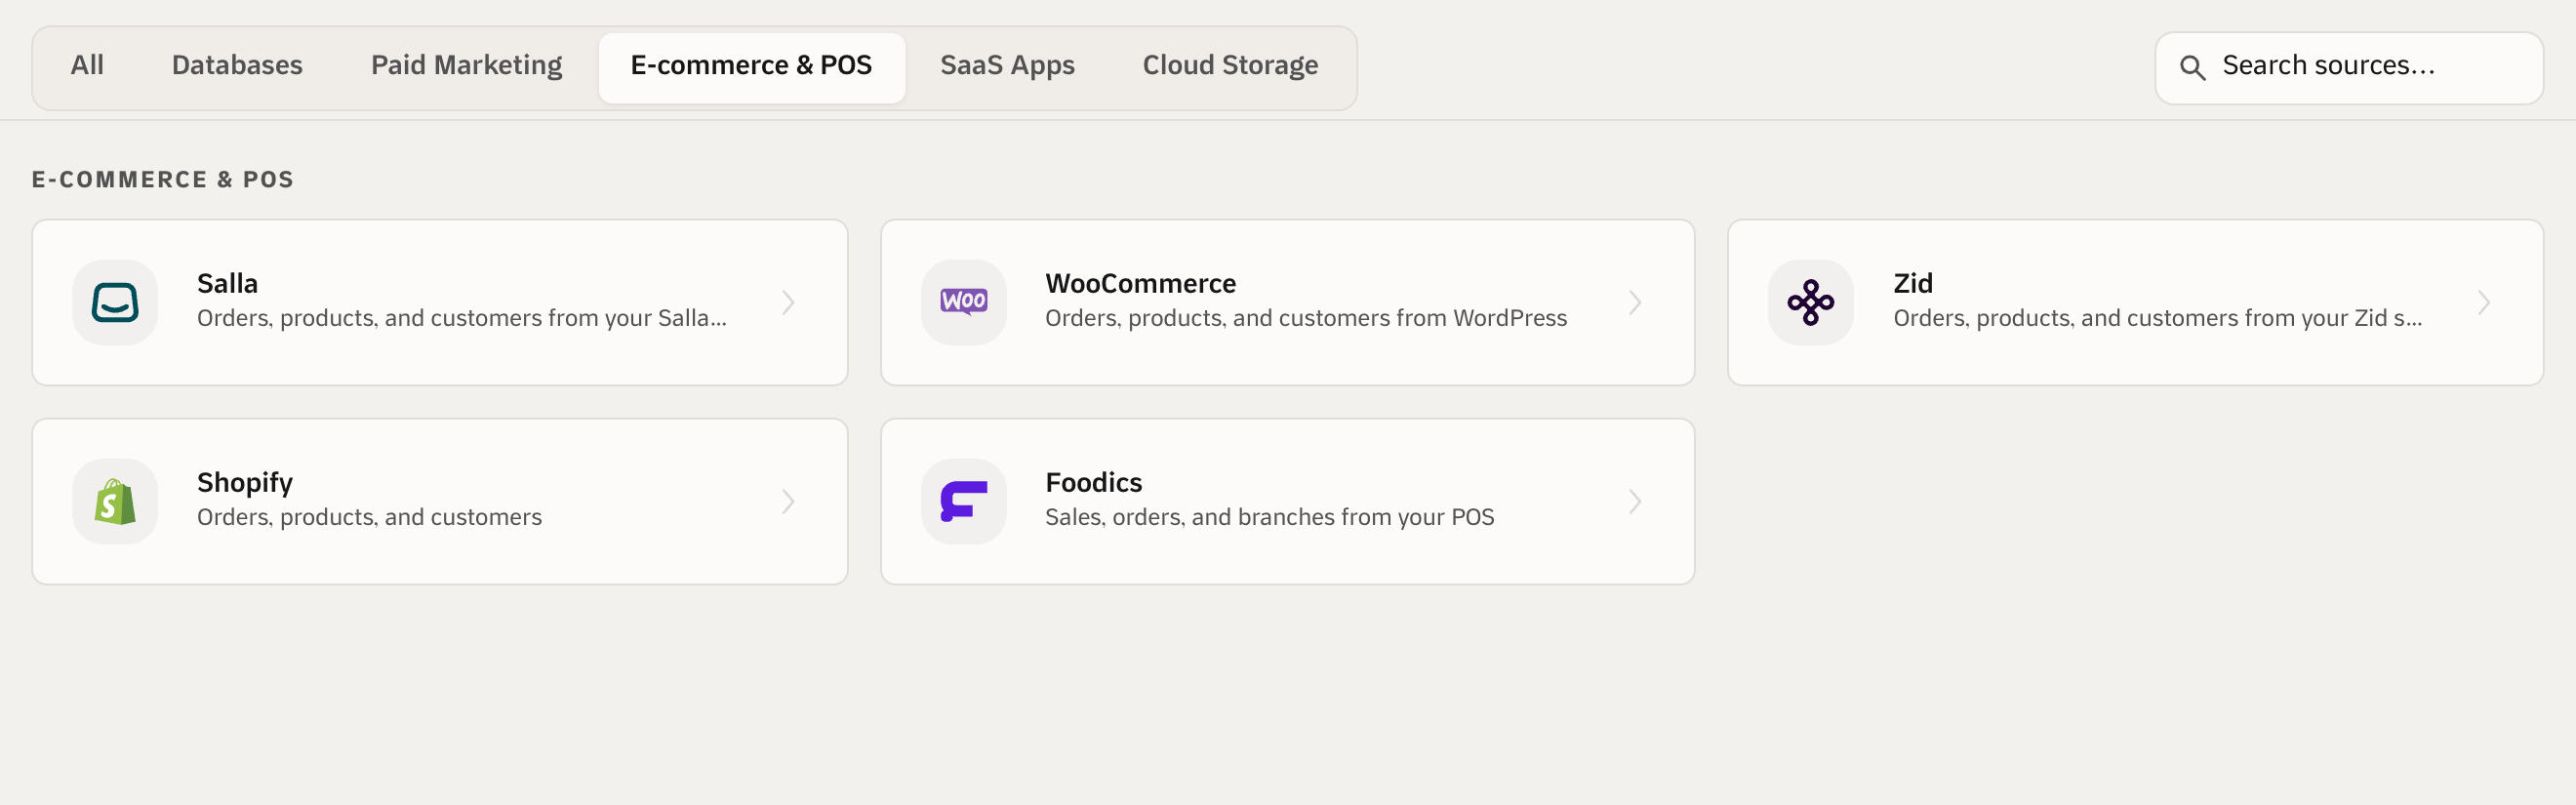
Connections to commerce and point-of-sale systems
Bring sales, finance and operations data together with ready-made connectors.
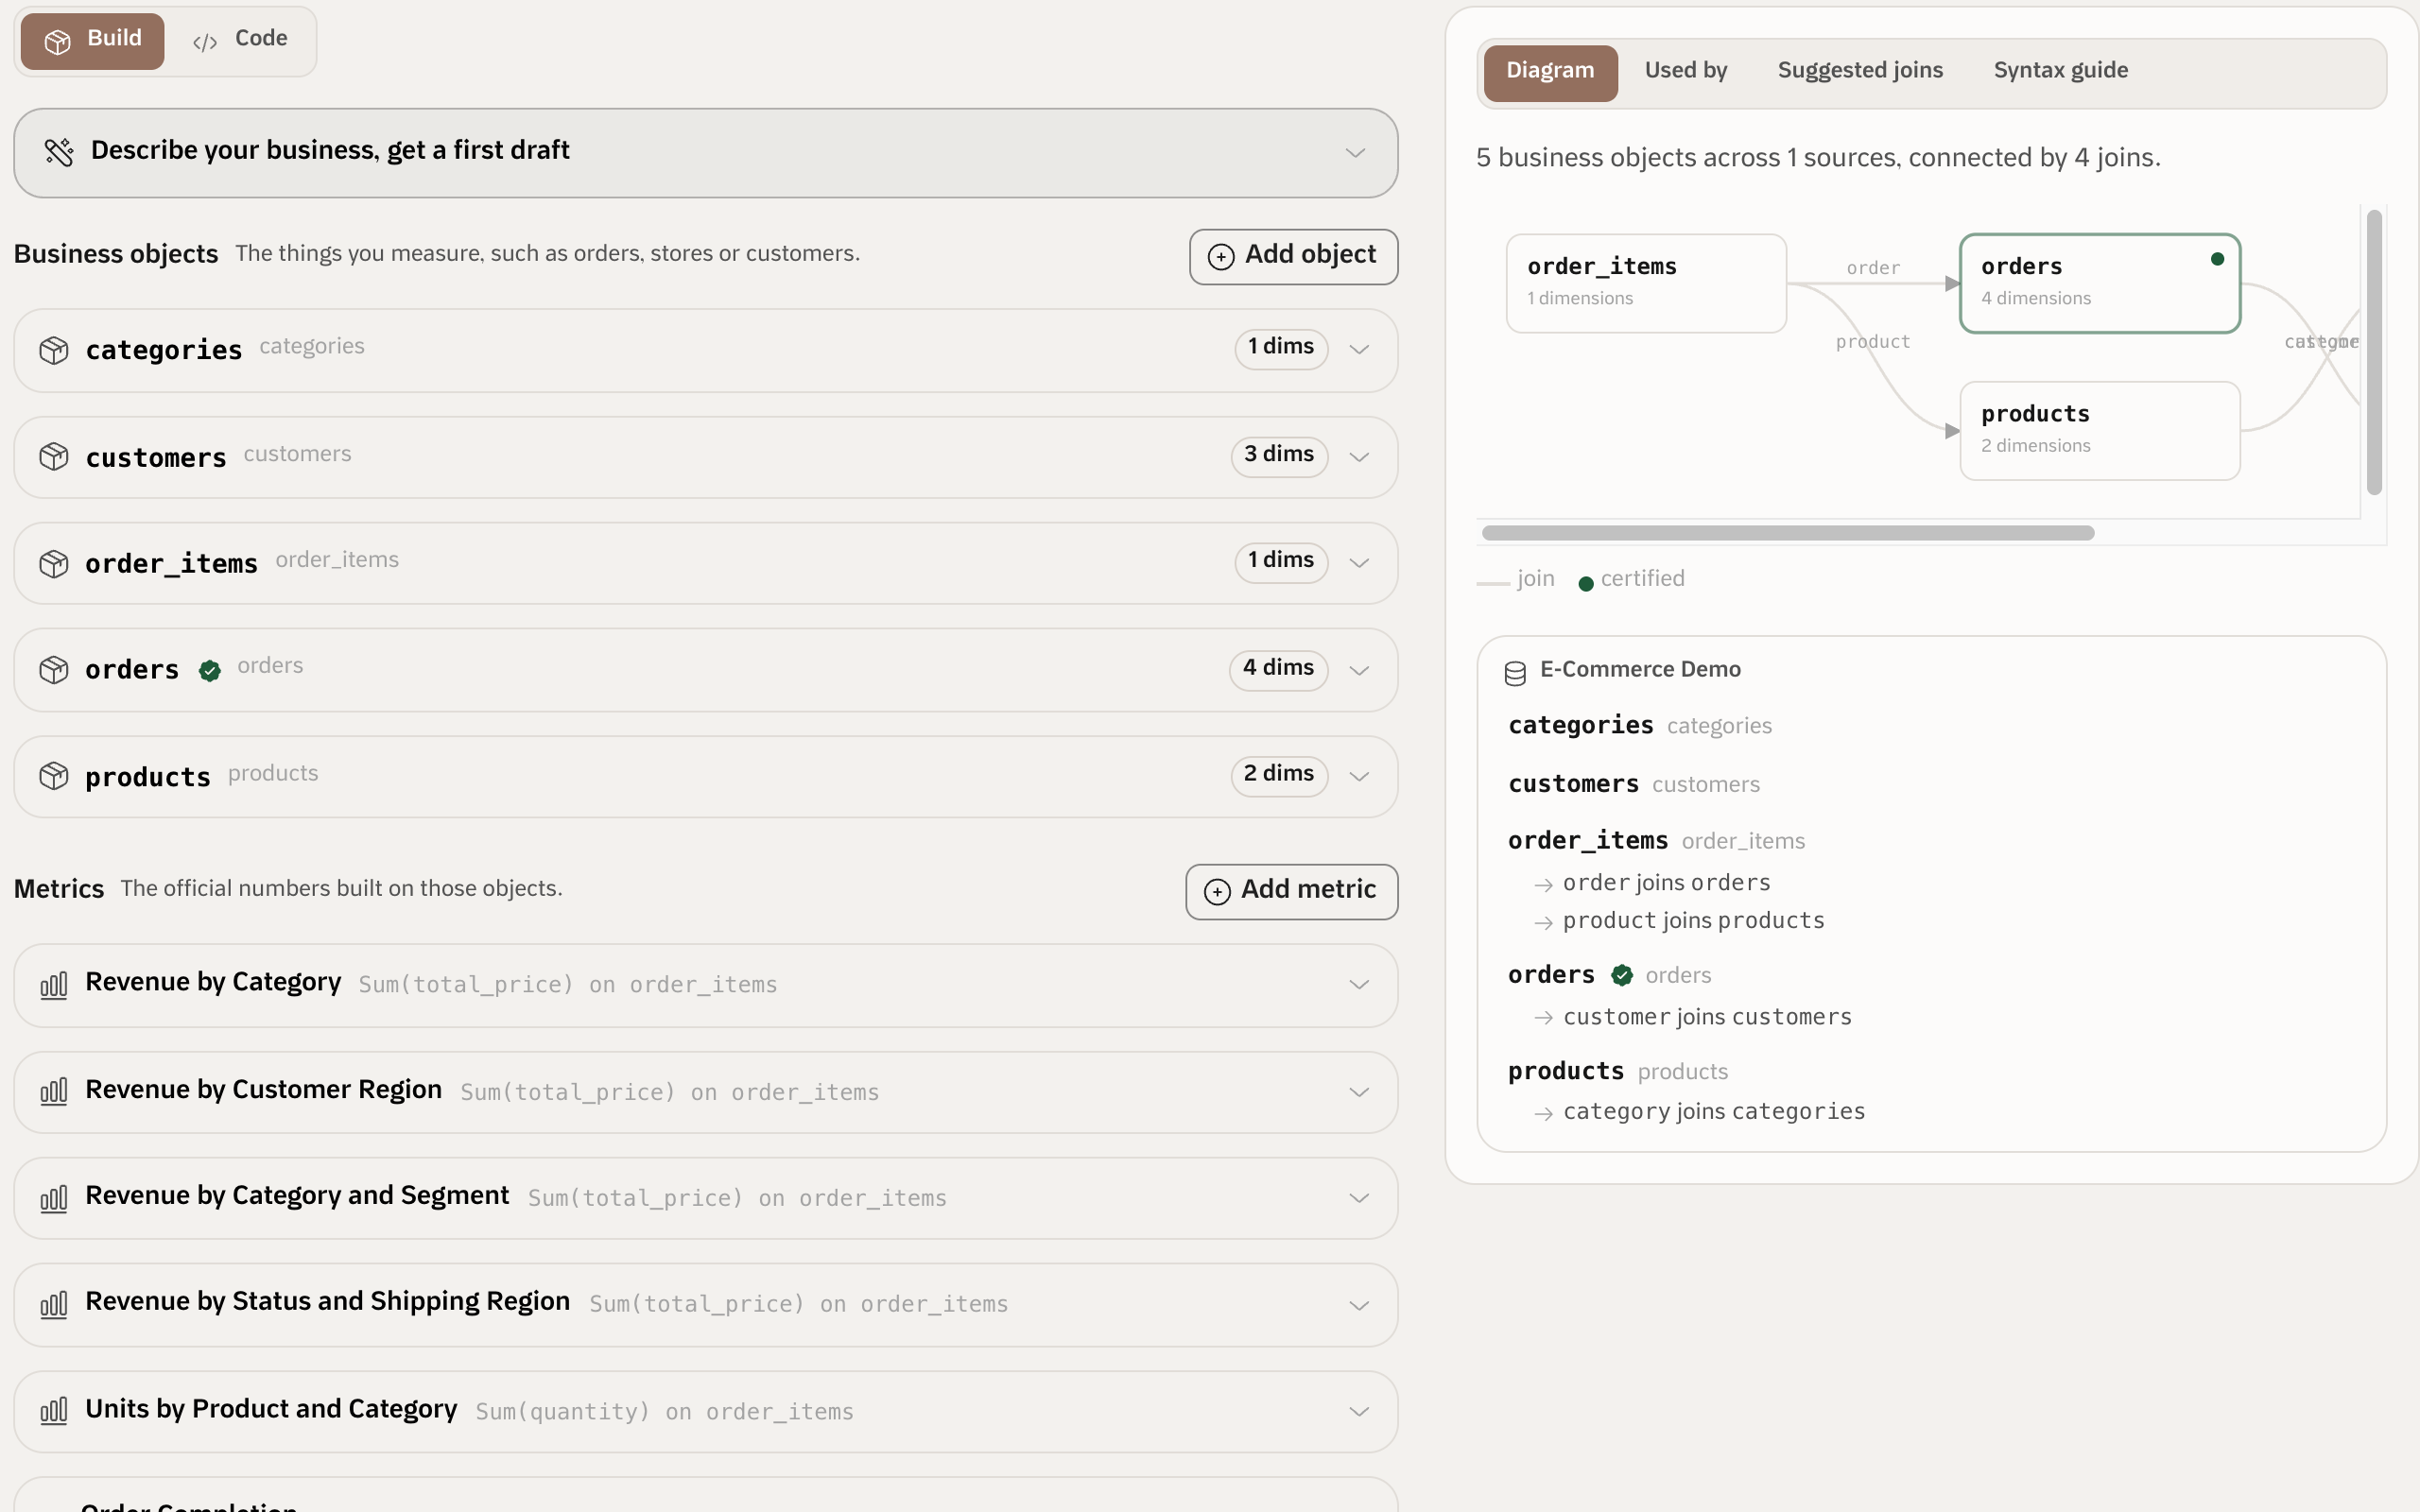
Shared metrics and business relationships
Model your tables, relationships and business terms in a shared semantic layer.
Data access by team and region
Use row-level security to scope data by region, branch or team while keeping a shared source of truth.
Current product screens · Demonstration business data
View full-size image ↗Questions your business asks.
Start with the decision your team needs to make, then examine the data behind it.
Sales and profitability
Which regions and products drove growth? Compare revenue and costs to understand the effect on margin.
Demand and inventory
Will a sales spike last after the promotion ends? Review demand before increasing purchase orders.
Management reporting
What changed since the last review? Bring the numbers and explanation into an editable PowerPoint report.
Access that fits your organisation.
Control each team’s data access, share consistent metric definitions, and choose where Qubit runs.
Read-only by default
Source connections are scoped for analysis and do not alter production records.
Row-level permissions
Scope records by role, such as limiting a regional team to its own sales data.
Shared business definitions
Define relationships and metrics in the semantic layer so teams work from the same business meaning.
Deployment and model choice
Run Saudi-hosted, in a private cloud, or on premise with the approved external or local models your organisation accepts.
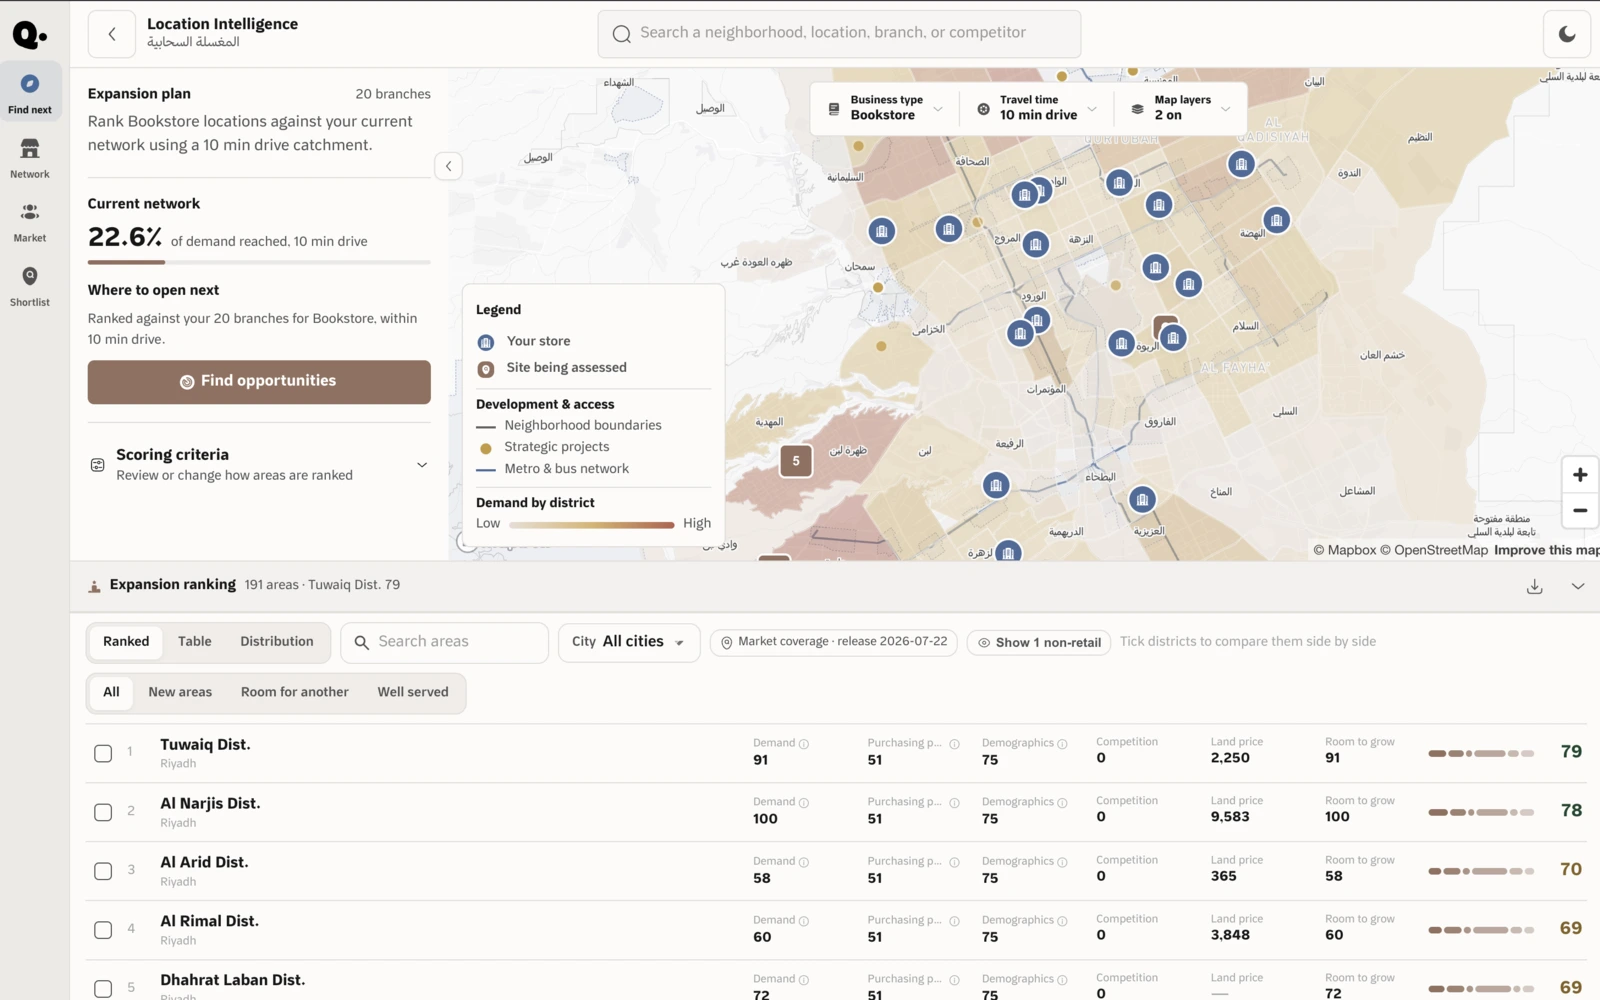
Explore more Qubit products.
Connections, identity, model controls, and audit are shared across the Qubit portfolio.
See Qubit with your business data.
Bring a business question or a recurring report. We’ll show you how it works in Qubit.