
Data analysis, made simple.
Upload a file or connect your data, then ask what you want to understand. Qubit turns the results into charts, dashboards, and reports.
SAR 39 monthly or SAR 399 annually. Cancel from billing at any time.
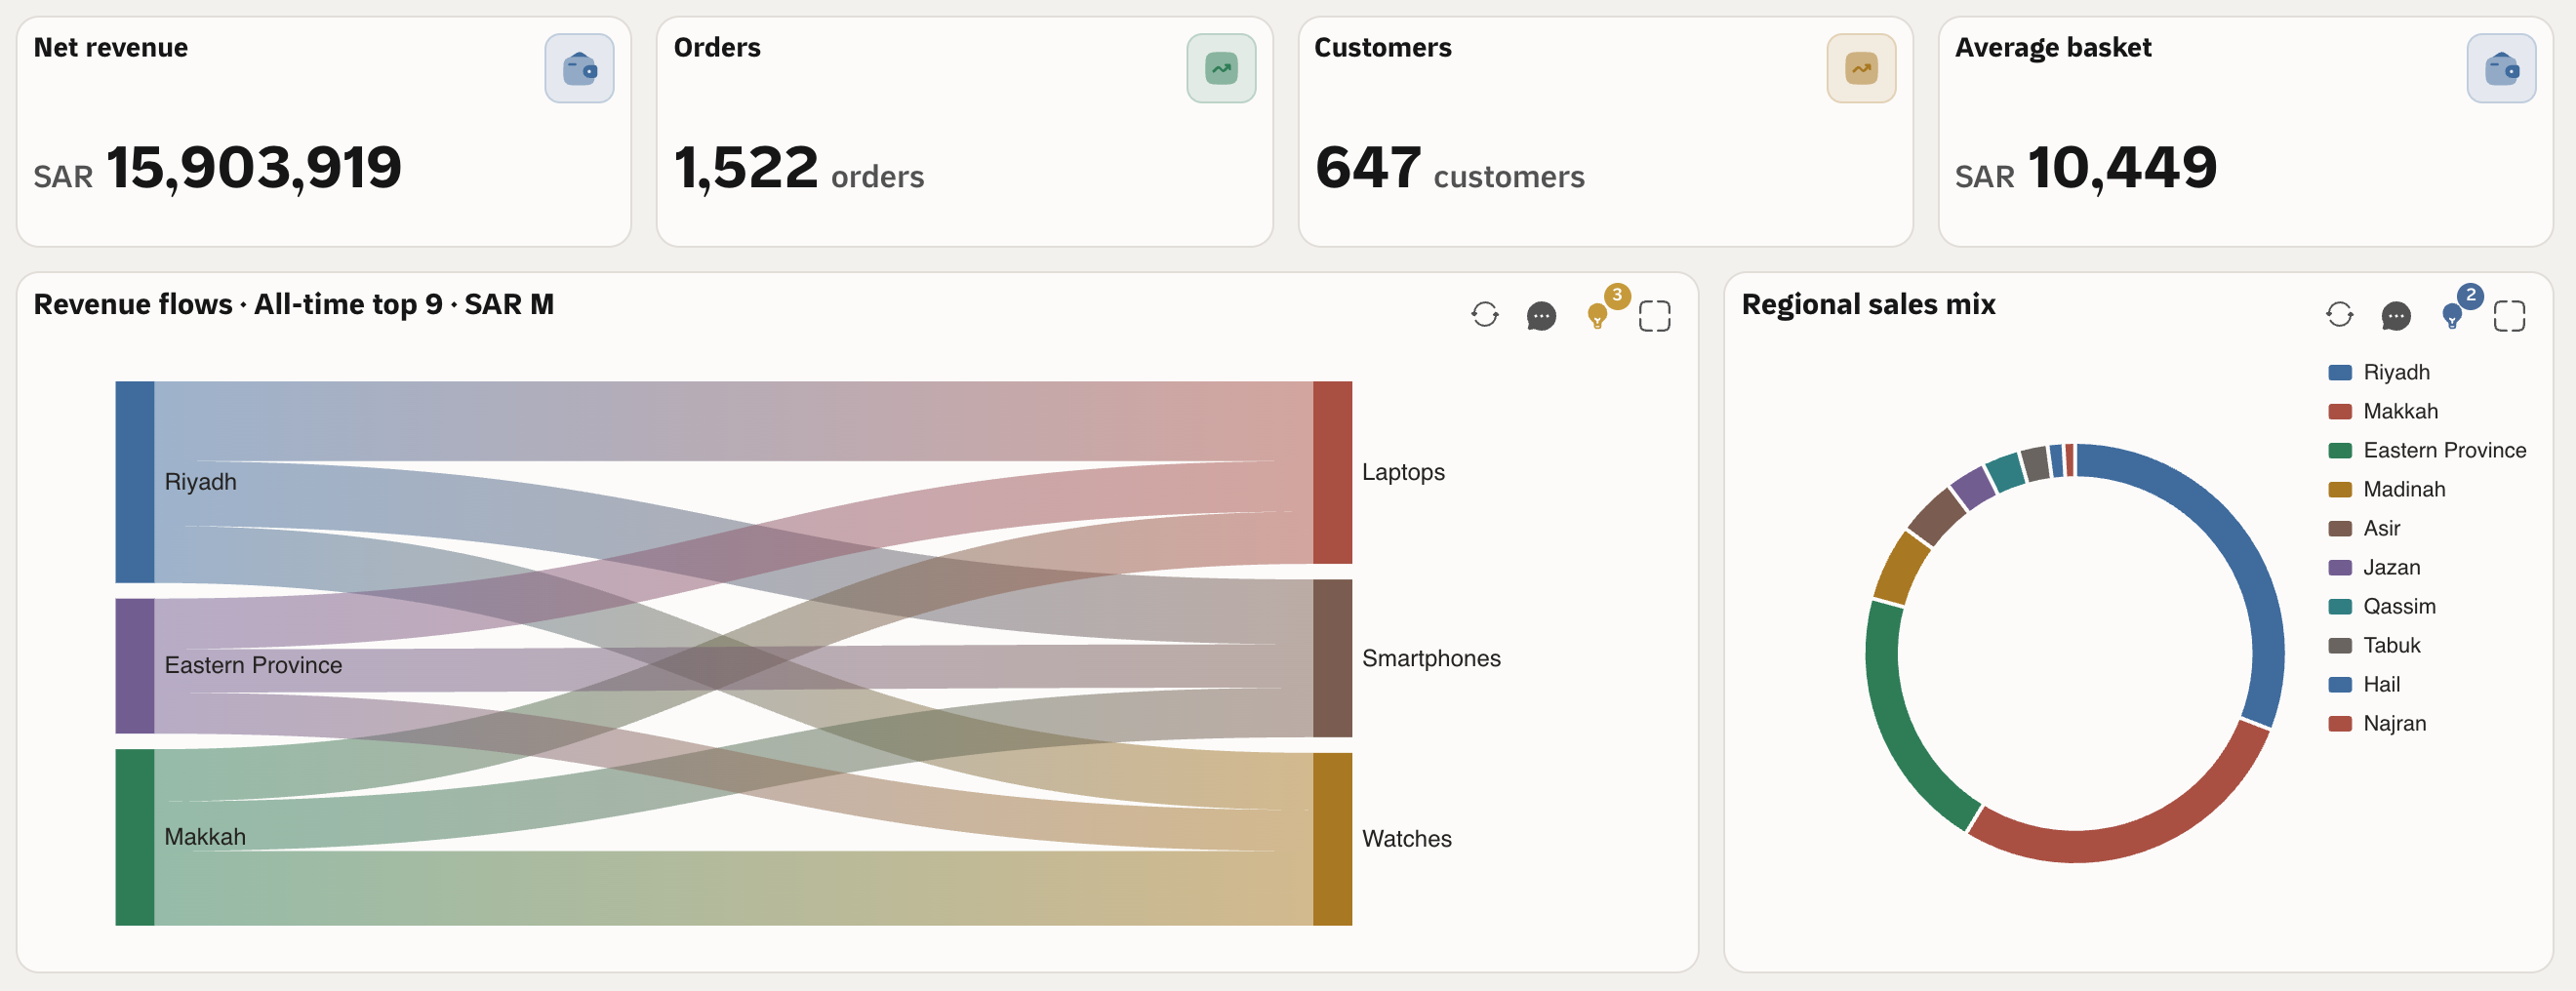
A simple question. A clearer analysis.
Explore data through conversation, see the results in charts and dashboards, and bring them together in an editable report.
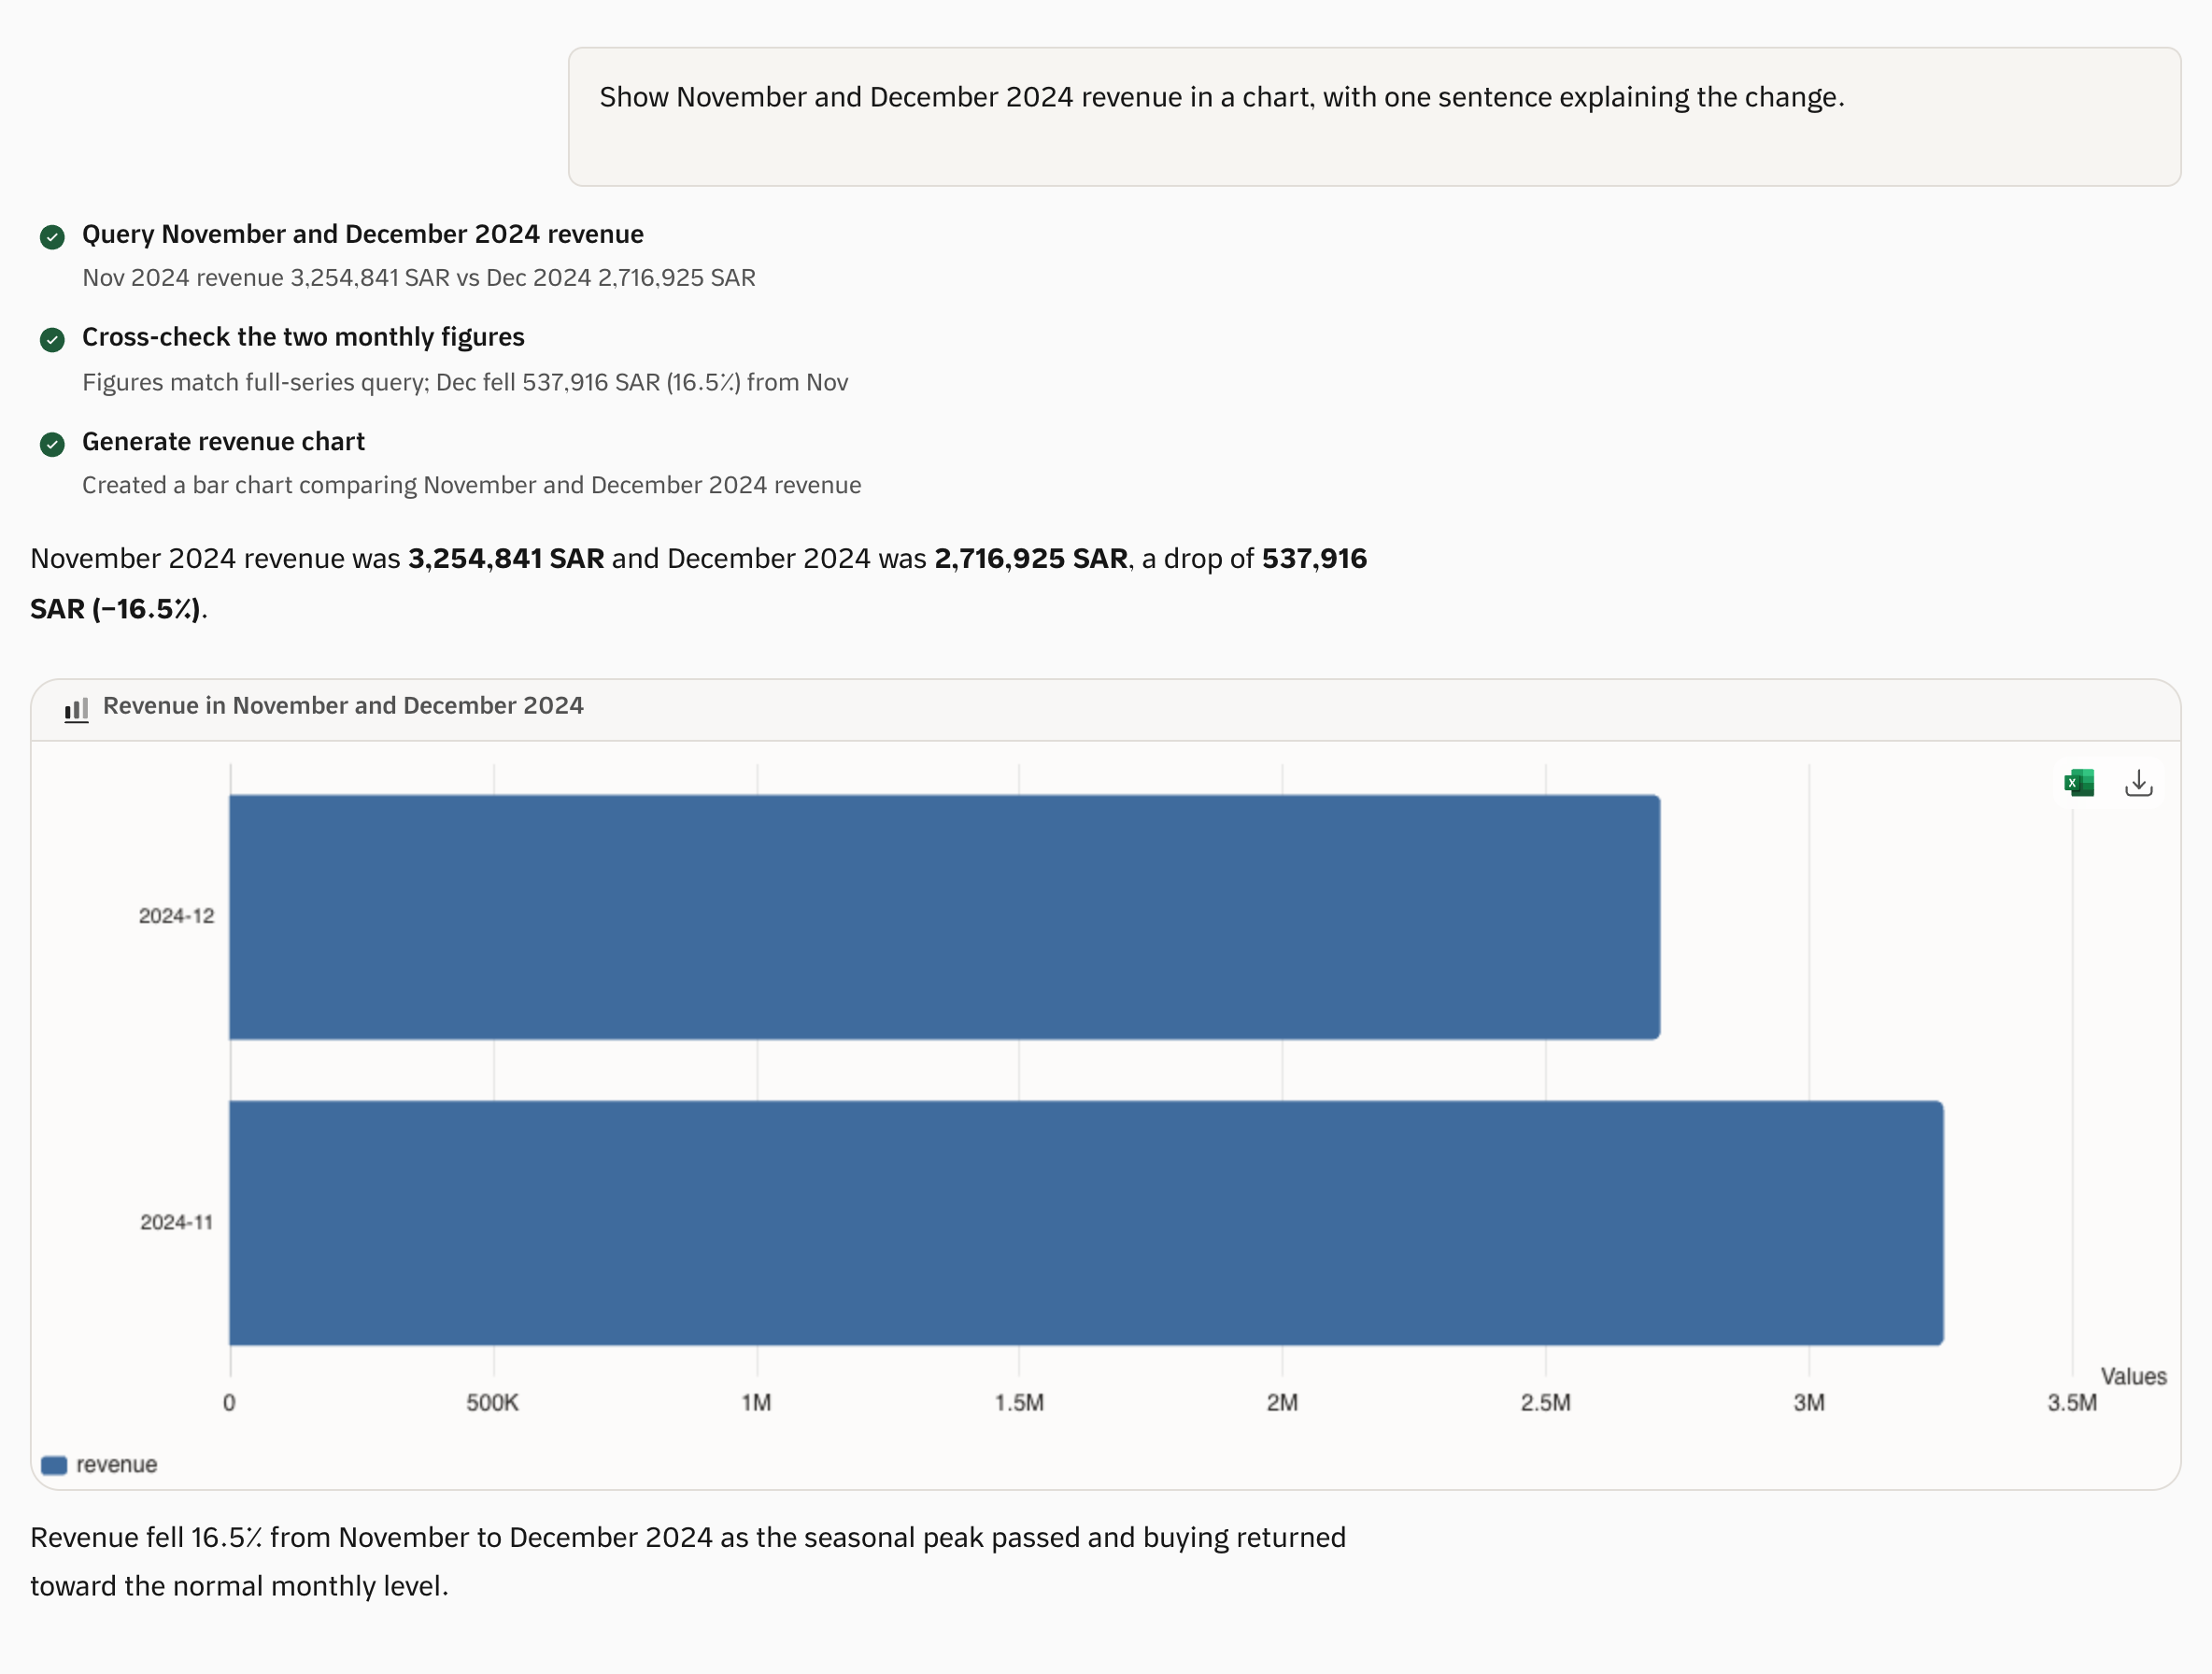
Your metrics, in one view
Describe the dashboard you need and let Qubit suggest charts for your data.
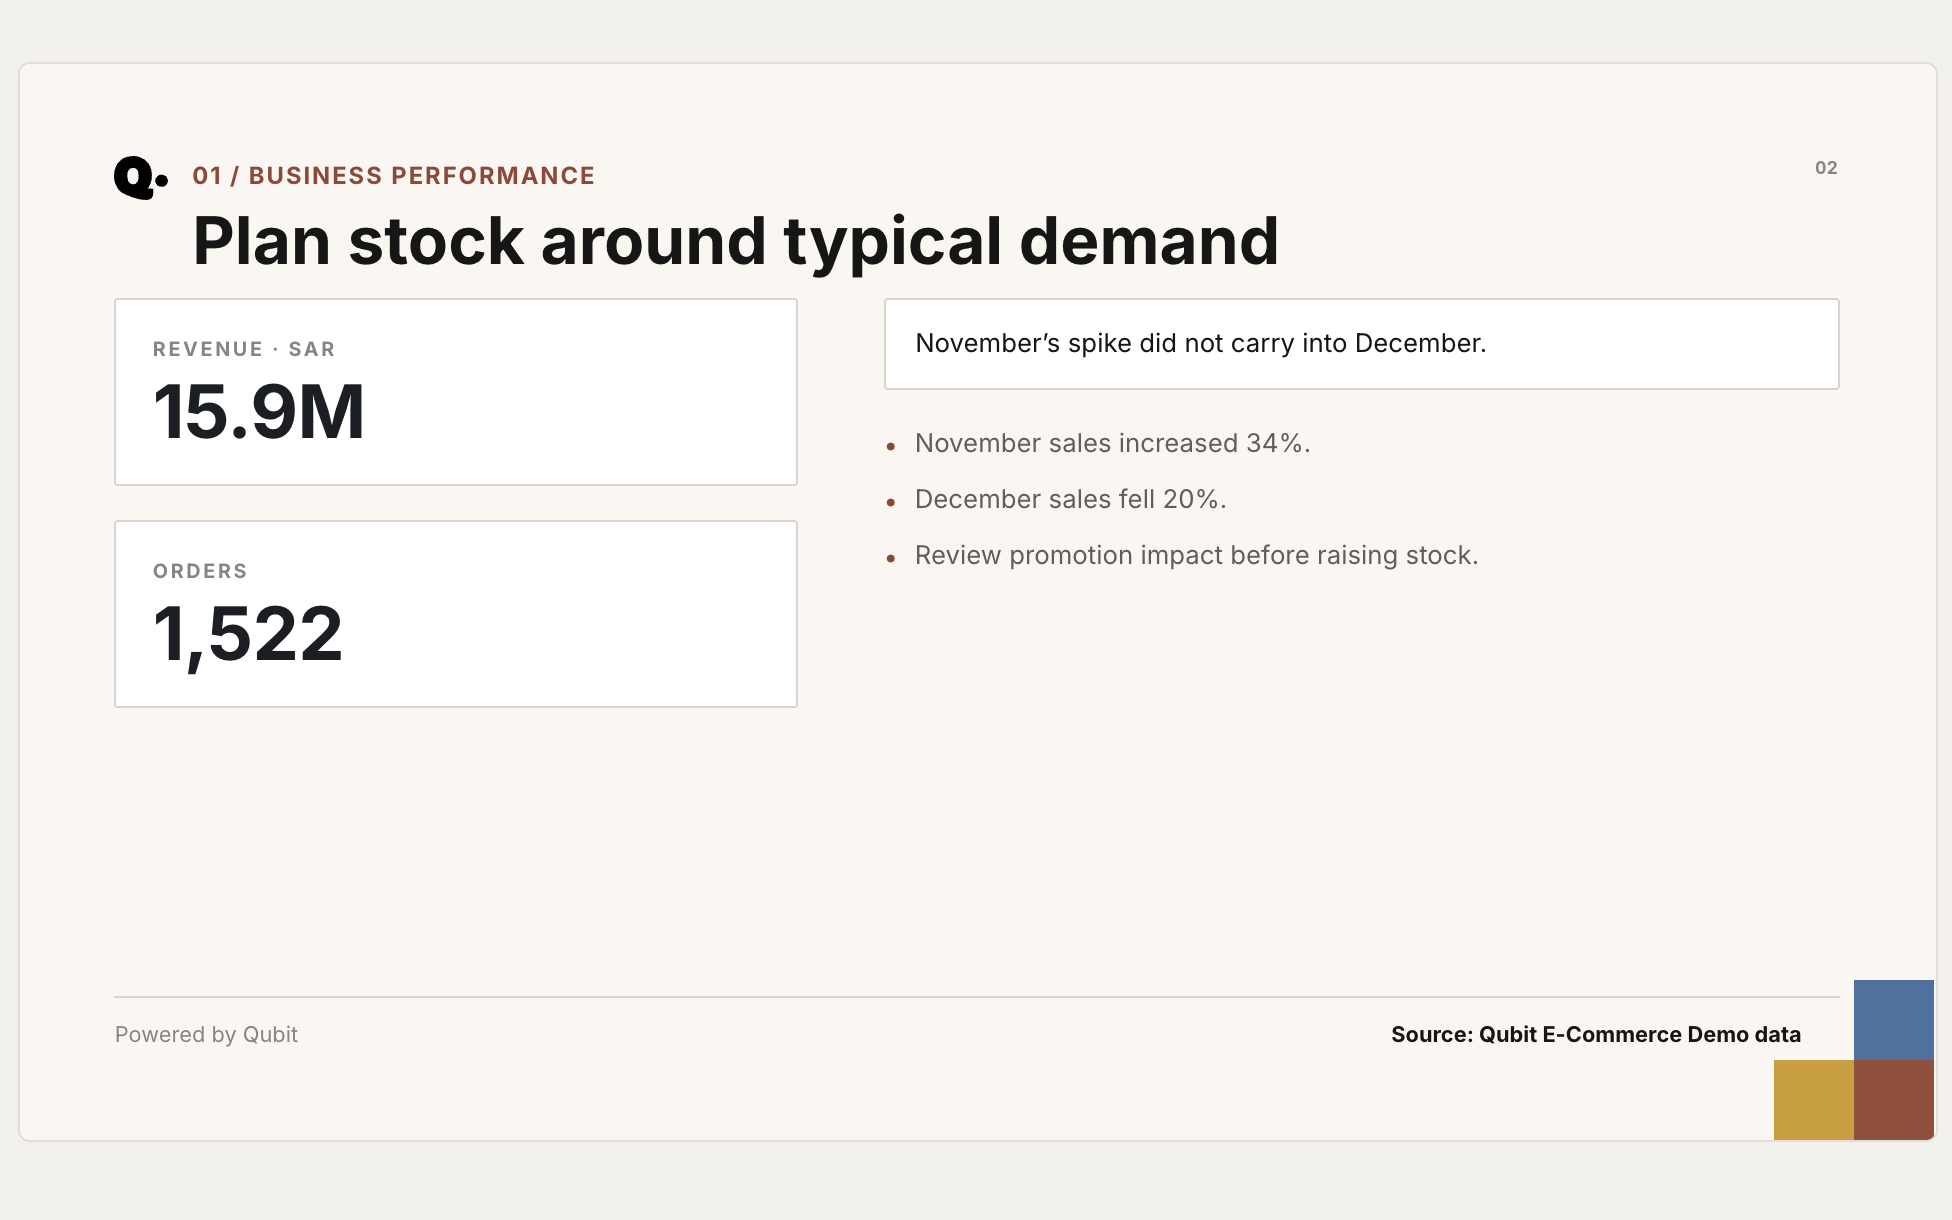
Analysis that starts with a question
Ask in English or Arabic. Qubit analyses the data and generates a chart you can explore with follow-up questions.
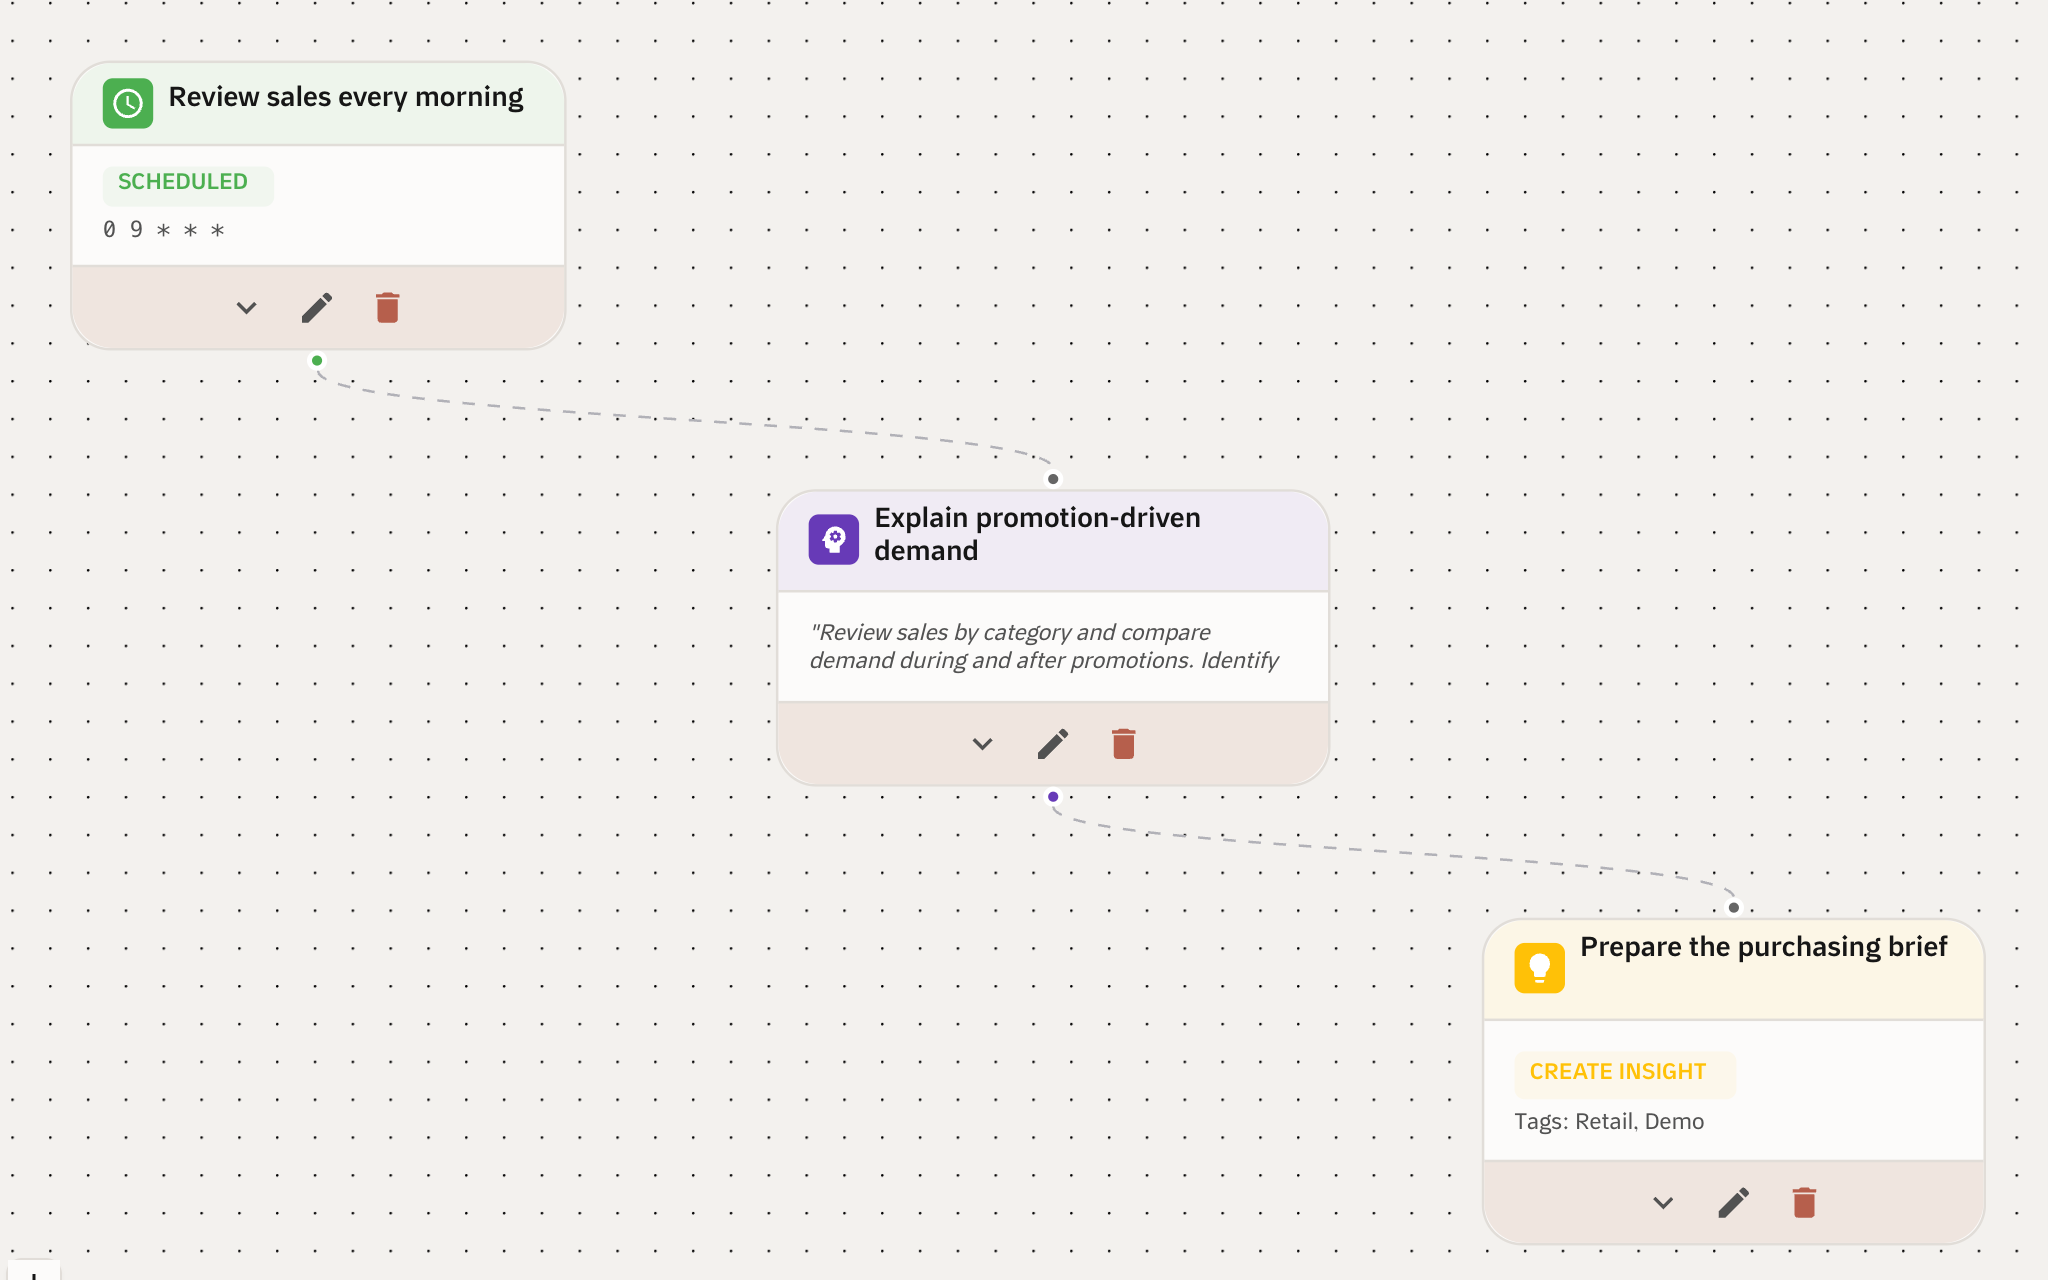
Reports that explain your findings
Bring charts and explanations into an editable PowerPoint report, ready to present.
Recurring analysis on your schedule
Set up your analysis steps once, then choose when they run again.
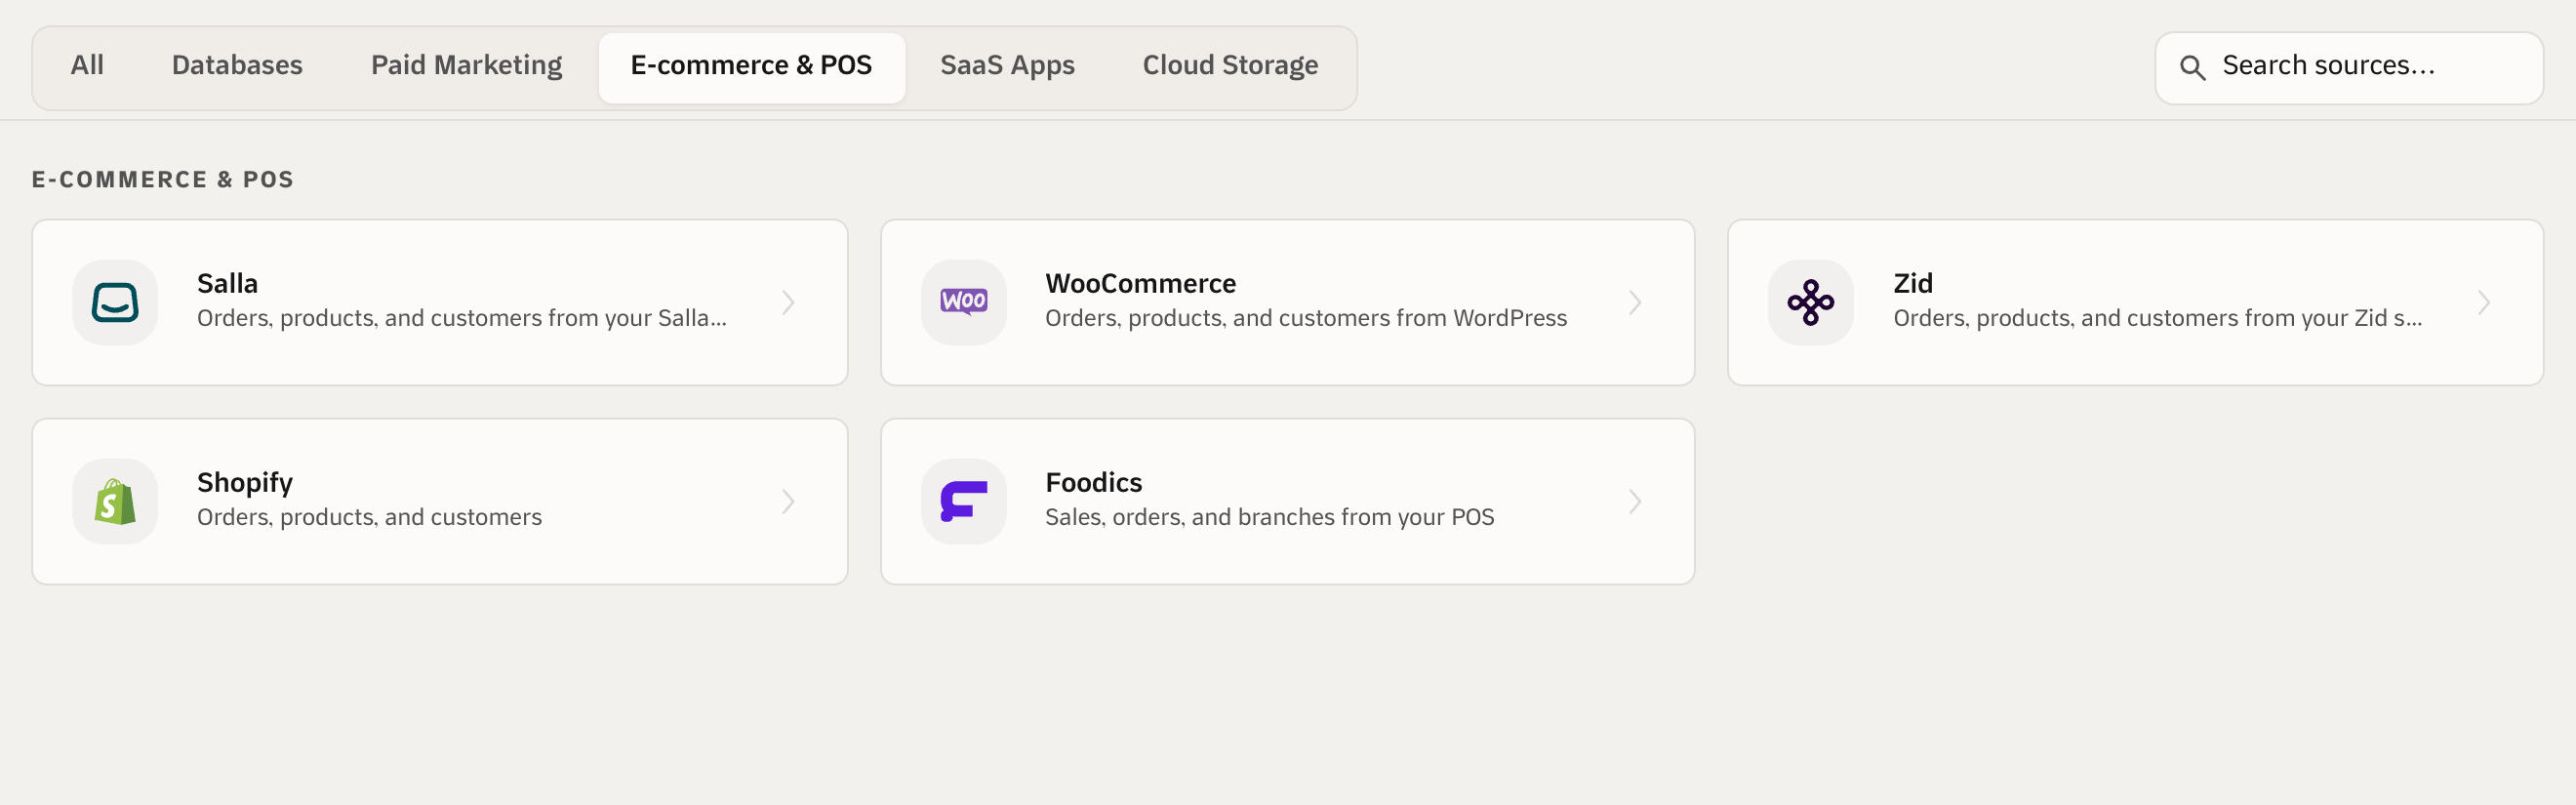
Start with your data
Choose a supported source or upload a file to begin your analysis in one place.
Current product screens · Demonstration data
View full-size image ↗Easier at every step of analysis.
Get to know a new dataset
Ask for a summary of the data and its distributions before diving into the details.
Find patterns and changes
Compare periods and categories, then follow what catches your attention with another question in the same conversation.
Explain your findings
Turn your analysis into charts and a report that is easy to present and discuss.
39SAR / month
The essential analysis tools for individual use, with one connected data source.
Or SAR 399 when billed annually.
Create your workspaceData connections
1 source
Combined data volume
Up to 2 million rows
Dashboards
2
Defined metrics
5
Automated workflows
2
Generated reports
2 each month
See how Qubit works.
See how a question becomes an analysis, a chart, and a dashboard inside Qubit.
View the post on Xلو انا صاحب مشروع واحتاج الذكاء الاصطناعي بستخدم هذي الاداة!
معاذ | في بحر data & ai 🌊 (@madebymouath) / July 27, 2026
🔹تساعدك بتحليل بيانتك بثواني
🔹تسوي لك داشبورد 📊
🔹تعطيك مقترحات مبنية عالبيانات
🔹تربط بقواعد بيانات كثيرة
🔹جدولة مهام معينه مثل مراقبة اسعار المنافسين 🙄
🔴🔴🔴
والأهم ان بياناتك داخل المملكة وتوافق مع متطلبات…
Plan details.
What data can I connect?
The plan includes one supported data connection. Once connected, you can analyse up to two million rows in that workspace.
Do I need technical or analytics experience?
No. You can ask questions in everyday Arabic or English, and build dashboards and reports from the same interface.
Can I change or cancel the plan?
Yes. You can manage or cancel the subscription from billing, and move to a business plan later if you need more people or capacity.
Start with your data and a question.
Create your workspace, upload a file or connect a source, and ask what you want to understand.
Create your workspace